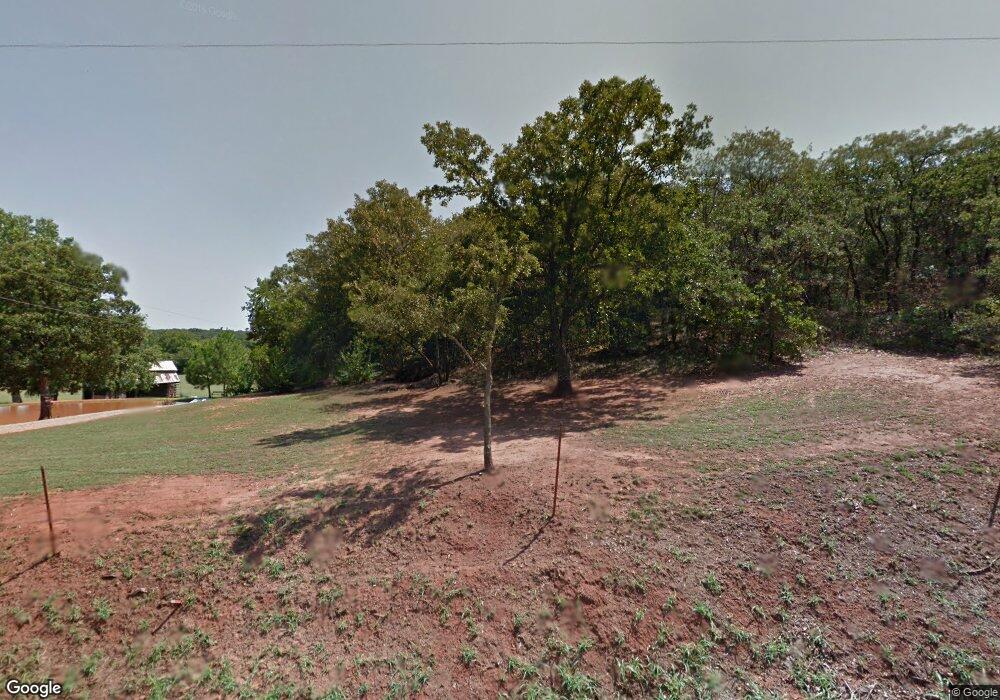
980798 S 3308 Rd Wellston, OK 74881
Estimated Value: $282,000 - $429,108
1
Bed
1
Bath
768
Sq Ft
$491/Sq Ft
Est. Value
About This Home
This home is located at 980798 S 3308 Rd, Wellston, OK 74881 and is currently estimated at $377,027, approximately $490 per square foot. 980798 S 3308 Rd is a home located in Lincoln County with nearby schools including Virginia Smith Elementary School, Russell Babb Elementary School, and Clara Reynolds Elementary School.
Ownership History
Date
Name
Owned For
Owner Type
Purchase Details
Closed on
Jul 30, 2020
Sold by
Littlejohn Lester J and Littlejohn Nancy C
Bought by
Monterastelli Michael Scott
Current Estimated Value
Home Financials for this Owner
Home Financials are based on the most recent Mortgage that was taken out on this home.
Original Mortgage
$236,000
Outstanding Balance
$209,269
Interest Rate
3.1%
Mortgage Type
New Conventional
Estimated Equity
$167,758
Purchase Details
Closed on
Feb 26, 1998
Sold by
Wynne Wynne B and Wynne Jennielee
Bought by
Littlejohn Lester J and Littlejohn Nanc
Purchase Details
Closed on
Jan 29, 1998
Sold by
Lancaster Glen A and Lancaster Diana D
Bought by
Wynne Wynne B and Wynne Jennielee
Purchase Details
Closed on
Feb 27, 1986
Sold by
Wynne Wynne B and Wynne Jennilee
Bought by
Lancaster Glen A and Lancaster Diana D
Create a Home Valuation Report for This Property
The Home Valuation Report is an in-depth analysis detailing your home's value as well as a comparison with similar homes in the area
Home Values in the Area
Average Home Value in this Area
Purchase History
| Date | Buyer | Sale Price | Title Company |
|---|---|---|---|
| Monterastelli Michael Scott | $295,000 | American Eagle Ttl Group Llc | |
| Littlejohn Lester J | $20,000 | -- | |
| Wynne Wynne B | -- | -- | |
| Lancaster Glen A | $26,000 | -- |
Source: Public Records
Mortgage History
| Date | Status | Borrower | Loan Amount |
|---|---|---|---|
| Open | Monterastelli Michael Scott | $236,000 |
Source: Public Records
Tax History Compared to Growth
Tax History
| Year | Tax Paid | Tax Assessment Tax Assessment Total Assessment is a certain percentage of the fair market value that is determined by local assessors to be the total taxable value of land and additions on the property. | Land | Improvement |
|---|---|---|---|---|
| 2025 | $4,390 | $40,046 | $6,494 | $33,552 |
| 2024 | $4,390 | $36,323 | $4,108 | $32,215 |
| 2023 | $4,390 | $37,405 | $4,108 | $33,297 |
| 2022 | $3,382 | $33,402 | $3,834 | $29,568 |
| 2021 | $3,285 | $32,428 | $4,348 | $28,080 |
| 2020 | $2,426 | $23,702 | $3,585 | $20,117 |
| 2019 | $2,347 | $23,011 | $3,187 | $19,824 |
| 2018 | $2,312 | $22,342 | $3,671 | $18,671 |
| 2017 | $2,207 | $21,691 | $3,616 | $18,075 |
| 2016 | $2,167 | $21,059 | $2,753 | $18,306 |
| 2015 | $1,868 | $20,446 | $2,750 | $17,696 |
| 2014 | $1,591 | $19,858 | $3,203 | $16,655 |
Source: Public Records
Map
Nearby Homes
- 0000 E 994 Rd
- 336241 E 980 Rd
- 9805754 S Oaktree Rd
- 0 S 3307 Rd
- 0 Lot 14 Toad Rd Unit 1192354
- 970692 Shady Oaks Rd
- 100782 S 3305 Rd
- 0 Lot 9 Toad Rd Unit 1192351
- 334358 E 980 Rd
- 330348 E 1010 Rd
- 980270 S Shadowwood Dr
- 100711 S Stonecrest Cir
- 980438 S Shadowwood Dr
- 3872 Ada Ave
- 21081 River Mist Dr
- 21089 River Mist Dr
- 3872 Louthea Ln
- 3864 Ada Ave
- 3880 Ada Ave
- 3857 Ada Ave
- 980905 S 3308 Rd
- 980970 S 3308 Rd
- 330932 E 990 Rd
- 330950 E 990 Rd
- 330695 E 990 Rd
- 330598 E 990 Rd
- 330825 E 990 Rd
- 0 Captain Creek Unit 1000920
- 980600 S 3310 Rd
- 990136 S Meadowood Dr
- 990067 S 3310 Rd
- 3084 E Wildwood Dr
- 990127 S Meadowood Dr
- 980509 3310 Rd
- 990139 S 3310 Rd
- 330591 E 990 Rd
- 330489 E 990 Rd
- 330624 E Wildwood Dr
- 3073 E Wildwood Dr
- 330877 E Wildwood Dr