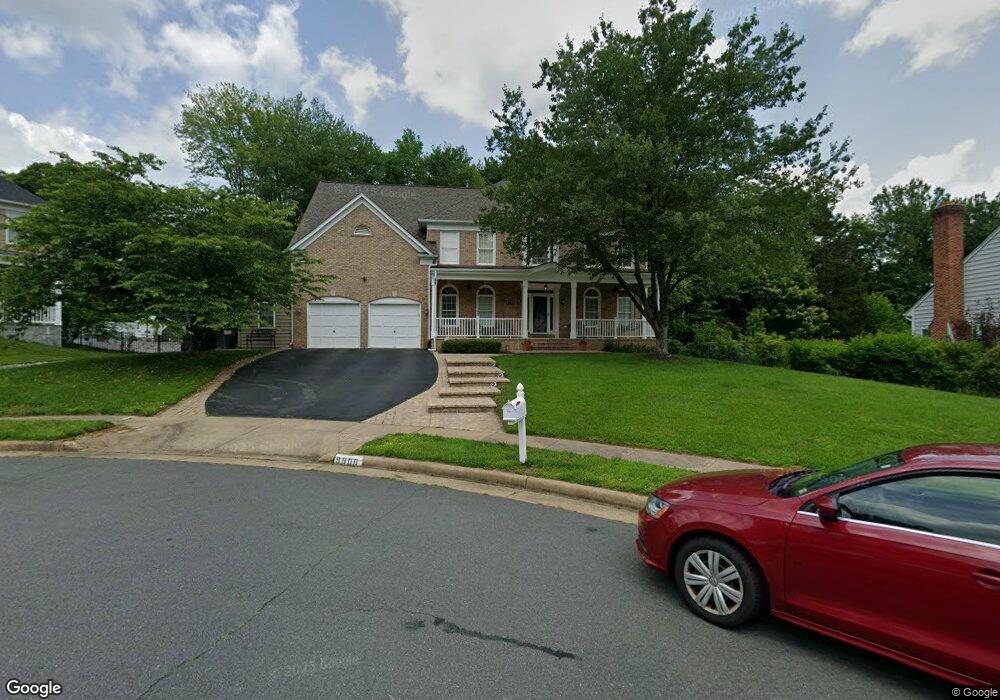
9808 John Robert Way Fairfax, VA 22032
Estimated Value: $1,213,422 - $1,493,000
4
Beds
5
Baths
3,810
Sq Ft
$356/Sq Ft
Est. Value
About This Home
This home is located at 9808 John Robert Way, Fairfax, VA 22032 and is currently estimated at $1,356,106, approximately $355 per square foot. 9808 John Robert Way is a home located in Fairfax County with nearby schools including Olde Creek Elementary School, Frost Middle School, and W. T. Woodson High School.
Ownership History
Date
Name
Owned For
Owner Type
Purchase Details
Closed on
Oct 20, 2016
Sold by
Salvi Anthony D and Salvi Rosemary B
Bought by
Salvi Rosemary B
Current Estimated Value
Home Financials for this Owner
Home Financials are based on the most recent Mortgage that was taken out on this home.
Original Mortgage
$277,000
Outstanding Balance
$222,208
Interest Rate
3.48%
Mortgage Type
New Conventional
Estimated Equity
$1,133,898
Purchase Details
Closed on
Jun 16, 2001
Sold by
Harrington Michael G
Bought by
Salvi Anthony D
Home Financials for this Owner
Home Financials are based on the most recent Mortgage that was taken out on this home.
Original Mortgage
$444,000
Interest Rate
7.15%
Purchase Details
Closed on
Jul 29, 1997
Sold by
Holly Park Dev Associates Lc
Bought by
Harrington Michael G and Harrington Catherine A
Home Financials for this Owner
Home Financials are based on the most recent Mortgage that was taken out on this home.
Original Mortgage
$415,600
Interest Rate
7.7%
Mortgage Type
New Conventional
Create a Home Valuation Report for This Property
The Home Valuation Report is an in-depth analysis detailing your home's value as well as a comparison with similar homes in the area
Home Values in the Area
Average Home Value in this Area
Purchase History
| Date | Buyer | Sale Price | Title Company |
|---|---|---|---|
| Salvi Rosemary B | -- | None Available | |
| Salvi Anthony D | $555,000 | -- | |
| Harrington Michael G | $439,030 | -- |
Source: Public Records
Mortgage History
| Date | Status | Borrower | Loan Amount |
|---|---|---|---|
| Open | Salvi Rosemary B | $277,000 | |
| Closed | Salvi Anthony D | $444,000 | |
| Previous Owner | Harrington Michael G | $415,600 |
Source: Public Records
Tax History Compared to Growth
Tax History
| Year | Tax Paid | Tax Assessment Tax Assessment Total Assessment is a certain percentage of the fair market value that is determined by local assessors to be the total taxable value of land and additions on the property. | Land | Improvement |
|---|---|---|---|---|
| 2025 | $11,947 | $1,041,250 | $336,000 | $705,250 |
| 2024 | $11,947 | $1,031,250 | $326,000 | $705,250 |
| 2023 | $11,638 | $1,031,250 | $326,000 | $705,250 |
| 2022 | $11,107 | $971,330 | $306,000 | $665,330 |
| 2021 | $10,598 | $903,110 | $266,000 | $637,110 |
| 2020 | $10,232 | $864,550 | $246,000 | $618,550 |
| 2019 | $9,936 | $839,550 | $221,000 | $618,550 |
| 2018 | $10,445 | $908,280 | $221,000 | $687,280 |
| 2017 | $9,792 | $843,370 | $207,000 | $636,370 |
| 2016 | $9,770 | $843,370 | $207,000 | $636,370 |
| 2015 | $9,050 | $810,890 | $199,000 | $611,890 |
| 2014 | $8,751 | $785,890 | $186,000 | $599,890 |
Source: Public Records
Map
Nearby Homes
- 9900 Barbara Ann Ln
- 3975 Lyndhurst Dr Unit 103
- 3874 Lyndhurst Dr Unit 103
- 4211 Orchard Dr
- 10118 Dwight Ave
- 4026 Walters Ct
- 3832 Farrcroft Dr
- 10121 Ratcliffe Manor Dr
- 4146 Addison Rd
- 10021 Glenmere Rd
- 4110 John Trammell Ct
- 3704 Persimmon Cir
- 10328 Sager Ave Unit 217
- 3814 Persimmon Cir
- 10196 Red Spruce Rd
- 10419 Courthouse Dr
- 9350 Tovito Dr
- 10134 Red Spruce Rd
- 3506 Queen Anne Dr
- 10404 Forest Ave
- 9804 John Robert Way
- 9812 John Robert Way
- 9817 Bolton Village Ct
- 9813 Bolton Village Ct
- 9811 Bolton Village Ct
- 9819 Bolton Village Ct
- 9809 Bolton Village Ct
- 4008 Crestar Ct
- 9821 Bolton Village Ct
- 9800 John Robert Way
- 4006 Crestar Ct
- 9807 Bolton Village Ct
- 9823 Bolton Village Ct
- 4003 Crestar Ct
- 9805 Bolton Village Ct
- 9809 John Robert Way
- 9805 John Robert Way
- 9803 Bolton Village Ct
- 9825 Bolton Village Ct
- 3700 Maple Ave