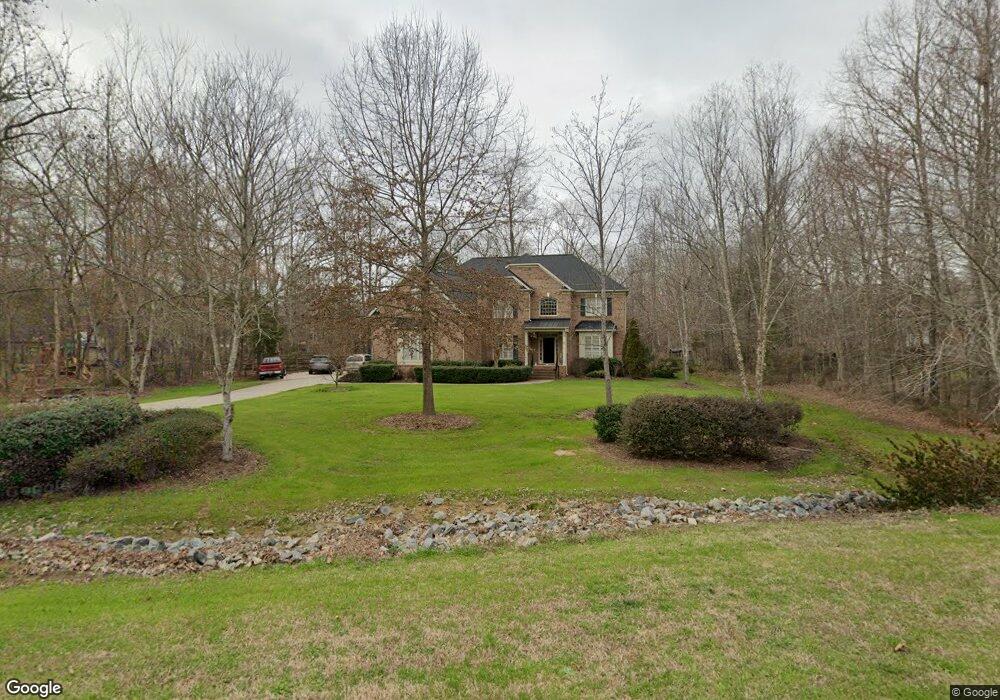
9809 Windrow Dr Indian Trail, NC 28079
Estimated Value: $789,822 - $912,000
4
Beds
4
Baths
3,550
Sq Ft
$243/Sq Ft
Est. Value
About This Home
This home is located at 9809 Windrow Dr, Indian Trail, NC 28079 and is currently estimated at $862,956, approximately $243 per square foot. 9809 Windrow Dr is a home located in Union County with nearby schools including Fairview Elementary School, Piedmont Middle School, and Piedmont High School.
Ownership History
Date
Name
Owned For
Owner Type
Purchase Details
Closed on
Apr 19, 2010
Sold by
Balise Peter S and Balise Sandra K
Bought by
Stanley Boyd V and Stanley Amy M
Current Estimated Value
Home Financials for this Owner
Home Financials are based on the most recent Mortgage that was taken out on this home.
Original Mortgage
$304,000
Outstanding Balance
$200,592
Interest Rate
4.97%
Mortgage Type
New Conventional
Estimated Equity
$662,364
Purchase Details
Closed on
May 24, 2006
Sold by
Testone James W and Testone Jeanette
Bought by
Balise Peter S and Balise Sandra K
Purchase Details
Closed on
Jul 29, 2005
Sold by
James Custom Homes Inc
Bought by
Testone James W
Home Financials for this Owner
Home Financials are based on the most recent Mortgage that was taken out on this home.
Original Mortgage
$323,040
Interest Rate
5.59%
Mortgage Type
Fannie Mae Freddie Mac
Purchase Details
Closed on
Nov 5, 2004
Sold by
Rushing Construction Co
Bought by
James Custom Homes Inc
Create a Home Valuation Report for This Property
The Home Valuation Report is an in-depth analysis detailing your home's value as well as a comparison with similar homes in the area
Home Values in the Area
Average Home Value in this Area
Purchase History
| Date | Buyer | Sale Price | Title Company |
|---|---|---|---|
| Stanley Boyd V | $380,000 | None Available | |
| Balise Peter S | $404,000 | None Available | |
| Testone James W | $404,000 | Chicago Title Insurance Comp | |
| James Custom Homes Inc | $660,000 | Chicago Title Insurance Comp |
Source: Public Records
Mortgage History
| Date | Status | Borrower | Loan Amount |
|---|---|---|---|
| Open | Stanley Boyd V | $304,000 | |
| Previous Owner | Testone James W | $323,040 |
Source: Public Records
Tax History
| Year | Tax Paid | Tax Assessment Tax Assessment Total Assessment is a certain percentage of the fair market value that is determined by local assessors to be the total taxable value of land and additions on the property. | Land | Improvement |
|---|---|---|---|---|
| 2025 | $3,968 | $777,000 | $0 | $0 |
| 2024 | $3,087 | $461,800 | $87,100 | $374,700 |
| 2023 | $3,040 | $461,800 | $87,100 | $374,700 |
| 2022 | $3,040 | $461,800 | $87,100 | $374,700 |
| 2021 | $3,043 | $461,800 | $87,100 | $374,700 |
| 2020 | $3,288 | $409,700 | $53,000 | $356,700 |
| 2019 | $3,176 | $409,700 | $53,000 | $356,700 |
| 2018 | $3,176 | $409,700 | $53,000 | $356,700 |
| 2017 | $3,352 | $406,000 | $53,000 | $353,000 |
| 2016 | $3,293 | $406,000 | $53,000 | $353,000 |
| 2015 | $3,334 | $406,000 | $53,000 | $353,000 |
| 2014 | $2,879 | $410,000 | $66,500 | $343,500 |
Source: Public Records
Map
Nearby Homes
- 15670 Bethel Avenue Extension
- 109 Brief Rd W
- 15655 Highway 601
- 1296 Ben Black Rd
- 3305 Drake Rd
- 4112 Mcmanus Rd Unit 2
- 16160 Hopewell Church Rd
- 8900 Blaydon Dr
- 8809 Blaydon Dr
- 419 Old Dutch Rd W
- 14011 Cabarrus Station Rd
- 7031 Friar Tuck Ln
- 13386 Cabarrus Station Rd
- 8446 Clear Meadow Ln
- 8524 Clear Meadow Ln
- 2622 Cimarron Cir
- 14027 Clayborn St
- 16612 Blackberry Hills Dr
- 13980 Clayborn St
- 8720 Unionville Brief Rd
- 9815 Windrow Dr
- 500 Foxglove Ln
- 506 Foxglove Ln
- 9814 Windrow Dr
- 9810 Windrow Dr
- 9901 Windrow Dr
- 9806 Windrow Dr
- 9800 Thornridge Dr
- 9800 Windrow Dr
- 9804 Thornridge Dr
- 505 Foxglove Ln
- 9905 Windrow Dr
- 9808 Thornridge Dr
- 501 Foxglove Ln
- 9712 Thornridge Dr
- 434 Foxglove Ln
- 9812 Thornridge Dr
- 417 Woodlark Ct
- 9500 Covey Trail
- 437 Foxglove Ln
Your Personal Tour Guide
Ask me questions while you tour the home.