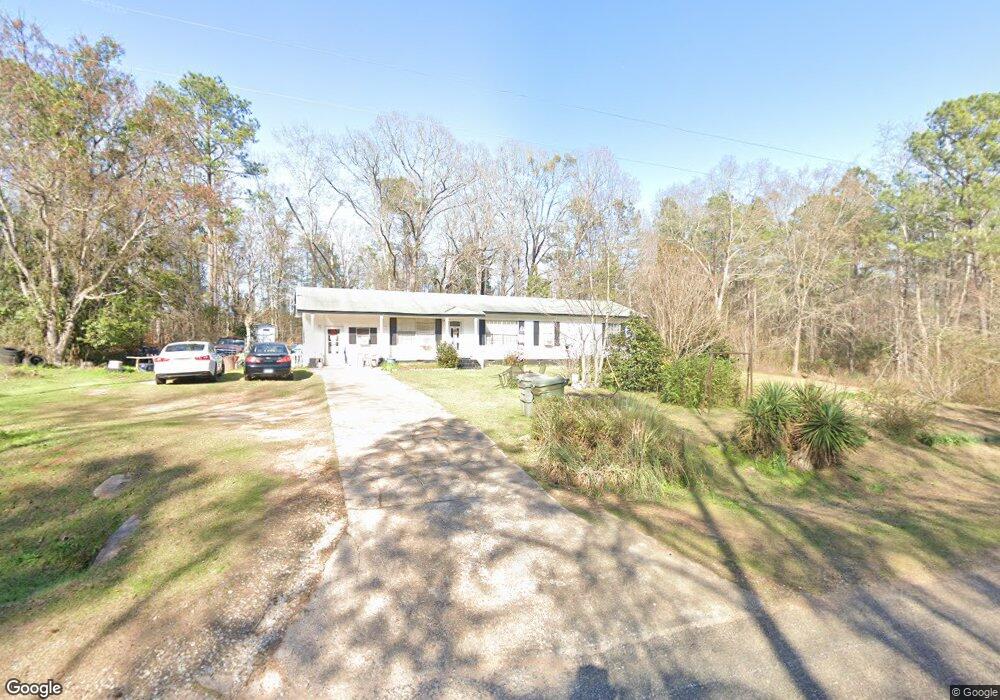
981 Lower Lumpkin Rd Georgetown, GA 39854
Estimated Value: $59,614 - $143,000
2
Beds
1
Bath
1,296
Sq Ft
$71/Sq Ft
Est. Value
About This Home
This home is located at 981 Lower Lumpkin Rd, Georgetown, GA 39854 and is currently estimated at $91,654, approximately $70 per square foot. 981 Lower Lumpkin Rd is a home located in Quitman County with nearby schools including Quitman County Elementary School and Quitman County High School.
Ownership History
Date
Name
Owned For
Owner Type
Purchase Details
Closed on
Jul 11, 2025
Sold by
Lee Dorothy
Bought by
Lee Dorothy
Current Estimated Value
Purchase Details
Closed on
Jan 31, 2019
Sold by
Lee Mattie Mae
Bought by
Lee Johnny and Lee Dorothy
Purchase Details
Closed on
Oct 8, 2008
Sold by
Lee Mattie Mae
Bought by
Lee Johnny W
Purchase Details
Closed on
Dec 27, 2007
Sold by
Jackson Sonya Mona
Bought by
Lee Mattie Mae
Purchase Details
Closed on
Sep 12, 2007
Sold by
Lee Barry D
Bought by
Lee Mattie Mae
Purchase Details
Closed on
Sep 10, 2007
Sold by
Guilford Marti L
Bought by
Lee Mattie Mae
Purchase Details
Closed on
Sep 5, 2007
Sold by
Jackson Marquis
Bought by
Lee Mattie Mae
Purchase Details
Closed on
Aug 31, 2007
Sold by
Lee Samuel
Bought by
Lee Mattie Mae
Purchase Details
Closed on
Aug 22, 2007
Sold by
Lee Larry D
Bought by
Lee Mattie Mae
Purchase Details
Closed on
Aug 14, 2007
Sold by
Lee Johnny W
Bought by
Lee Mattie Mae
Purchase Details
Closed on
Mar 20, 1972
Sold by
Lee William
Bought by
Builders Homes Inc
Purchase Details
Closed on
Jan 1, 1901
Bought by
Lee William
Create a Home Valuation Report for This Property
The Home Valuation Report is an in-depth analysis detailing your home's value as well as a comparison with similar homes in the area
Home Values in the Area
Average Home Value in this Area
Purchase History
| Date | Buyer | Sale Price | Title Company |
|---|---|---|---|
| Lee Dorothy | -- | -- | |
| Lee Johnny | -- | -- | |
| Lee Johnny W | -- | -- | |
| Lee Mattie Mae | -- | -- | |
| Lee Mattie Mae | -- | -- | |
| Lee Mattie Mae | -- | -- | |
| Lee Mattie Mae | -- | -- | |
| Lee Mattie Mae | -- | -- | |
| Lee Mattie Mae | -- | -- | |
| Lee Mattie Mae | -- | -- | |
| Lee Mattie Mae | -- | -- | |
| Lee Mattie Mae | -- | -- | |
| Lee Mattie Mae | -- | -- | |
| Builders Homes Inc | -- | -- | |
| Lee William | $17,200 | -- | |
| Lee William | -- | -- |
Source: Public Records
Tax History Compared to Growth
Tax History
| Year | Tax Paid | Tax Assessment Tax Assessment Total Assessment is a certain percentage of the fair market value that is determined by local assessors to be the total taxable value of land and additions on the property. | Land | Improvement |
|---|---|---|---|---|
| 2025 | $519 | $22,352 | $2,056 | $20,296 |
| 2024 | $519 | $22,352 | $2,056 | $20,296 |
| 2023 | $522 | $22,352 | $2,056 | $20,296 |
| 2022 | $522 | $22,352 | $2,056 | $20,296 |
| 2021 | $233 | $14,004 | $1,521 | $12,483 |
| 2020 | $233 | $14,004 | $1,521 | $12,483 |
| 2019 | $233 | $14,004 | $1,521 | $12,483 |
| 2018 | $448 | $14,004 | $1,521 | $12,483 |
| 2017 | $162 | $14,401 | $1,521 | $12,880 |
| 2016 | $168 | $14,401 | $1,521 | $12,880 |
| 2015 | -- | $14,401 | $1,521 | $12,880 |
| 2014 | -- | $14,401 | $1,521 | $12,880 |
| 2013 | -- | $14,401 | $1,520 | $12,880 |
Source: Public Records
Map
Nearby Homes
- 0 Lots 2 3 4 Point Dr Unit 20065
- 0 Tanglewood Trail Unit 27290
- 683 Union Church Rd Unit LotWP001
- 683 Union Church Rd
- 15 Bay Ln
- 2036 Georgia 39
- 1794 Georgia 50
- 0 Lower Lumpkin Rd
- 0 Lower Lumpkin Rd Unit 10511110
- 0 Old 39 Rd Unit 15.69
- 15.69 Old 39 Rd
- 253 Kaigler Rd
- 330 Georgia 27
- Old Fort Gaines Rd
- 76 Jacqueline Dr
- 0 Jacqueline Dr
- 2+/- Ac Fawn Dr
- 00 Georgia 39
- 0 Sandra Dr Unit 10544581
- 0 Sandra Dr Unit 27509