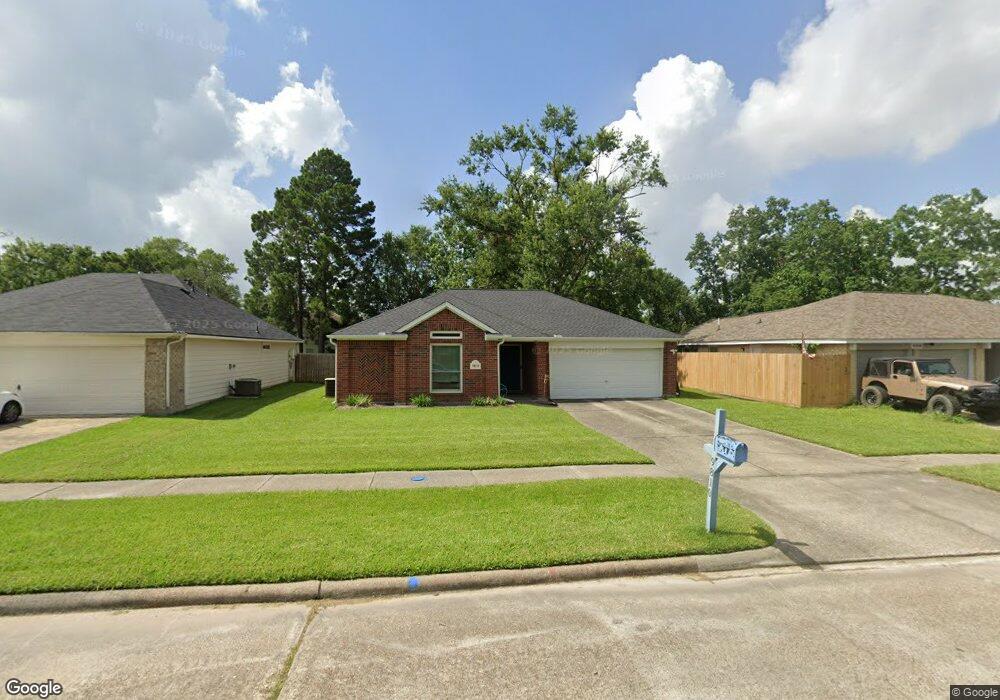
9810 Bobolink Dr Conroe, TX 77385
Estimated Value: $232,091 - $247,000
3
Beds
2
Baths
1,452
Sq Ft
$164/Sq Ft
Est. Value
About This Home
This home is located at 9810 Bobolink Dr, Conroe, TX 77385 and is currently estimated at $238,773, approximately $164 per square foot. 9810 Bobolink Dr is a home located in Montgomery County with nearby schools including Oak Ridge Elementary School, Irons J High School, and Vogel Intermediate School.
Ownership History
Date
Name
Owned For
Owner Type
Purchase Details
Closed on
May 31, 2018
Sold by
Sunshiny Day Inc
Bought by
Rowles Randy
Current Estimated Value
Purchase Details
Closed on
Jul 3, 2017
Sold by
Sowell Colton D and Steinecke Taylor K
Bought by
Sunshiny Day Inc
Purchase Details
Closed on
Oct 9, 2014
Sold by
Esguerra Ric C and Esguerra Lilli Ann
Bought by
Sowell Colton D and Steinecke Taylor K
Home Financials for this Owner
Home Financials are based on the most recent Mortgage that was taken out on this home.
Original Mortgage
$123,717
Interest Rate
4.37%
Mortgage Type
FHA
Purchase Details
Closed on
Oct 5, 2013
Sold by
Saint Francis Miemorial Tr
Bought by
Sowell Colton and Sowell Taylor
Purchase Details
Closed on
Jun 1, 2009
Sold by
Esguerra Ric
Bought by
Saint Francis Memorial Trust
Purchase Details
Closed on
Nov 25, 2003
Sold by
Chien Larry T K and Chien Han Yu
Bought by
Kendall Homes Corp
Create a Home Valuation Report for This Property
The Home Valuation Report is an in-depth analysis detailing your home's value as well as a comparison with similar homes in the area
Home Values in the Area
Average Home Value in this Area
Purchase History
| Date | Buyer | Sale Price | Title Company |
|---|---|---|---|
| Rowles Randy | -- | None Available | |
| Sunshiny Day Inc | -- | Fidelity National Title | |
| Sowell Colton D | -- | None Available | |
| Sowell Colton | -- | -- | |
| Esguerna Ric | -- | None Available | |
| Saint Francis Memorial Trust | -- | None Available | |
| Kendall Homes Corp | -- | Chicago Title Insurance Co |
Source: Public Records
Mortgage History
| Date | Status | Borrower | Loan Amount |
|---|---|---|---|
| Previous Owner | Sowell Colton D | $123,717 | |
| Closed | Kendall Homes Corp | $0 |
Source: Public Records
Tax History
| Year | Tax Paid | Tax Assessment Tax Assessment Total Assessment is a certain percentage of the fair market value that is determined by local assessors to be the total taxable value of land and additions on the property. | Land | Improvement |
|---|---|---|---|---|
| 2025 | $5,178 | $223,604 | $29,680 | $193,924 |
| 2024 | $5,246 | $233,139 | $29,680 | $203,459 |
| 2023 | $5,246 | $236,110 | $29,680 | $206,430 |
| 2022 | $4,608 | $224,640 | $29,680 | $194,960 |
| 2021 | $4,660 | $178,610 | $29,680 | $148,930 |
| 2020 | $4,858 | $176,120 | $29,680 | $146,440 |
| 2019 | $4,387 | $152,100 | $16,960 | $135,140 |
| 2018 | $4,036 | $139,910 | $16,960 | $122,950 |
| 2017 | $4,175 | $142,070 | $16,960 | $126,880 |
| 2016 | $1,898 | $64,580 | $8,480 | $56,100 |
| 2015 | $3,456 | $64,580 | $8,480 | $56,100 |
| 2014 | $3,456 | $107,130 | $16,960 | $90,170 |
Source: Public Records
Map
Nearby Homes
- 102 Wimberly Way
- 9838 Bobolink Dr
- 16731 Foursquare Dr
- 74 Wimberly Way
- 16758 N Blue Jay Dr
- 16820 Infield Ct
- 174 N Wimberly Way
- 16771 N Rail Dr
- 9809 Wren Ct
- 16751 N Rail Dr
- 251 N Wimberly Way
- 16763 N Gull Dr
- 219 N Wimberly Way
- 27 Harmony Hollow Ct
- 16870 Blackberry Lily Ln
- 16774 Fallen Timbers Dr
- 14 Bay Chapel Ct
- 16746 Fallen Timbers Dr
- 16937 Larkspur
- 9906 Knob Hollow Way
- 9814 Bobolink Dr
- 9806 Bobolink Dr
- 9818 Bobolink Dr
- 9809 Heron Ln
- 9813 Heron Ln
- 9805 Heron Ln
- 16805 Gleneagle Dr N
- 16801 Gleneagle Dr N
- 16809 Gleneagle Dr N
- 9822 Bobolink Dr
- 9817 Heron Ln
- 9807 Bobolink Dr
- 16787 Warbler Dr
- 9803 Bobolink Dr
- 16813 Gleneagle Dr N
- 16783 Warbler Dr
- 9826 Bobolink Dr
- 9820 Heron Ln
- 16778 Warbler Dr
- 16786 Canary Ct
Your Personal Tour Guide
Ask me questions while you tour the home.