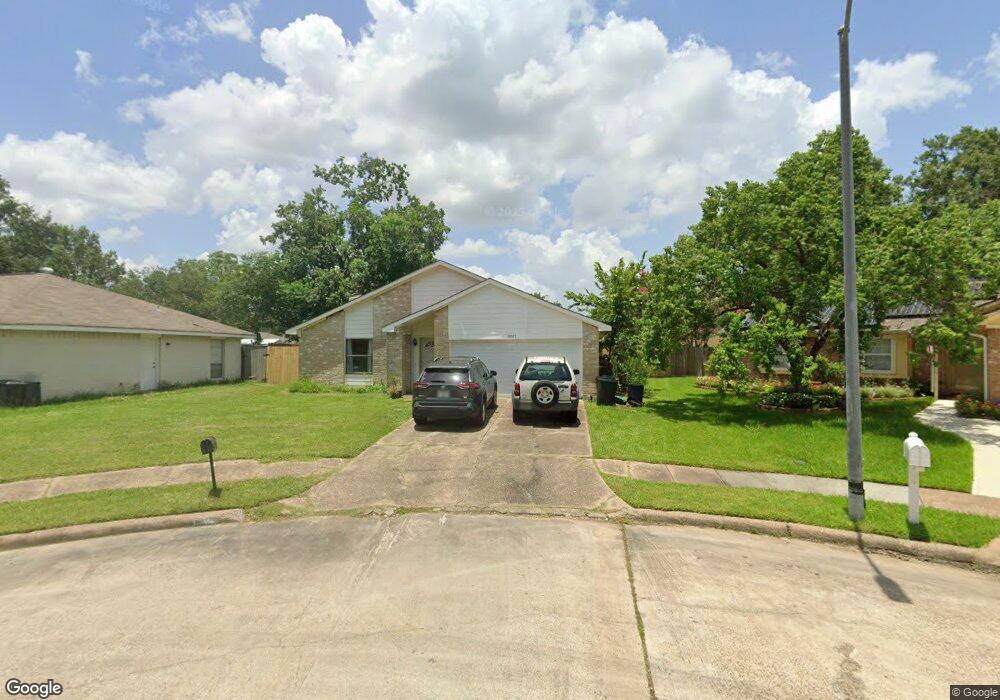
9811 Kiwi Ln Conroe, TX 77385
Estimated Value: $208,414 - $217,000
About This Home
This home is located at 9811 Kiwi Ln, Conroe, TX 77385 and is currently estimated at $212,604, approximately $139 per square foot. 9811 Kiwi Ln is a home located in Montgomery County with nearby schools including Oak Ridge Elementary School, Irons J High School, and Vogel Intermediate School.
Ownership History
We collect this data history from publicly available records. To have your information removed, we recommend requesting removal directly through your county’s website.
Purchase Details
Home Financials for this Owner
Home Financials are based on the most recent Mortgage that was taken out on this home.Purchase Details
Home Financials for this Owner
Home Financials are based on the most recent Mortgage that was taken out on this home.Purchase Details
Purchase Details
Home Values in the Area
Average Home Value in this Area
Purchase History
We collect this data history from publicly available records. To have your information removed, we recommend requesting removal directly through your county’s website.
| Date | Buyer | Sale Price | Title Company |
|---|---|---|---|
| -- | First American Title | ||
| -- | First American Title | ||
| -- | -- | ||
| -- | -- |
Mortgage History
We collect this data history from publicly available records. To have your information removed, we recommend requesting removal directly through your county’s website.
| Date | Status | Borrower | Loan Amount |
|---|---|---|---|
| Open | $117,826 | ||
| Previous Owner | $76,950 |
Tax History
We collect this data history from publicly available records. To have your information removed, we recommend requesting removal directly through your county’s website.
| Year | Tax Paid | Tax Assessment Tax Assessment Total Assessment is a certain percentage of the fair market value that is determined by local assessors to be the total taxable value of land and additions on the property. | Land | Improvement |
|---|---|---|---|---|
| 2025 | $2,641 | $152,000 | $27,006 | $124,994 |
| 2024 | $2,582 | $179,616 | $27,006 | $152,610 |
| 2023 | $2,582 | $177,000 | $27,010 | $149,990 |
| 2022 | $3,324 | $162,030 | $27,010 | $160,220 |
| 2021 | $3,843 | $147,300 | $27,010 | $120,290 |
| 2020 | $3,792 | $137,470 | $27,010 | $111,820 |
| 2019 | $3,605 | $124,970 | $15,430 | $109,540 |
| 2018 | $2,806 | $120,200 | $15,430 | $104,770 |
| 2017 | $3,494 | $118,880 | $15,430 | $104,770 |
| 2016 | $3,176 | $108,070 | $15,430 | $92,640 |
| 2015 | $2,251 | $108,070 | $15,430 | $92,640 |
| 2014 | $2,251 | $81,980 | $15,430 | $69,290 |
Map
- 16937 Larkspur
- 9806 Tanager Ln
- 16945 Scenic Knoll
- 16820 Infield Ct
- 16731 Foursquare Dr
- 16852 Greenhouse St
- 16848 Greenhouse St
- 16870 Blackberry Lily Ln
- 17123 Spindle Oaks Dr
- 102 Wimberly Way
- 74 Wimberly Way
- 0 Sprawling Oaks Dr
- 9881 Hyacinth Way
- 9915 Valance Way
- 203 Fairwind Trail Dr
- 9906 Knob Hollow Way
- 9877 Lace Flower Way
- 16790 N Rail Dr
- 7 Raindance Ct
- 251 N Wimberly Way
- 9807 Kiwi Ln
- 9815 Kiwi Ln
- 9808 Wren Ct
- 9812 Wren Ct
- 9819 Kiwi Ln
- 9804 Wren Ct
- 16925 Gleneagle Dr N
- 16929 Gleneagle Dr N
- 16921 Gleneagle Dr N
- 9818 Kiwi Ln
- 9806 Kiwi Ln
- 9806 Kiwi Ln
- 9810 Kiwi Ln
- 9816 Wren Ct
- 16922 Meadowlark St
- 16917 Glen Eagle Dr N
- 16918 Meadowlark St
- 16926 Meadowlark St
- 16917 Gleneagle Dr N
- 9814 Kiwi Ln
Ask me questions while you tour the home.