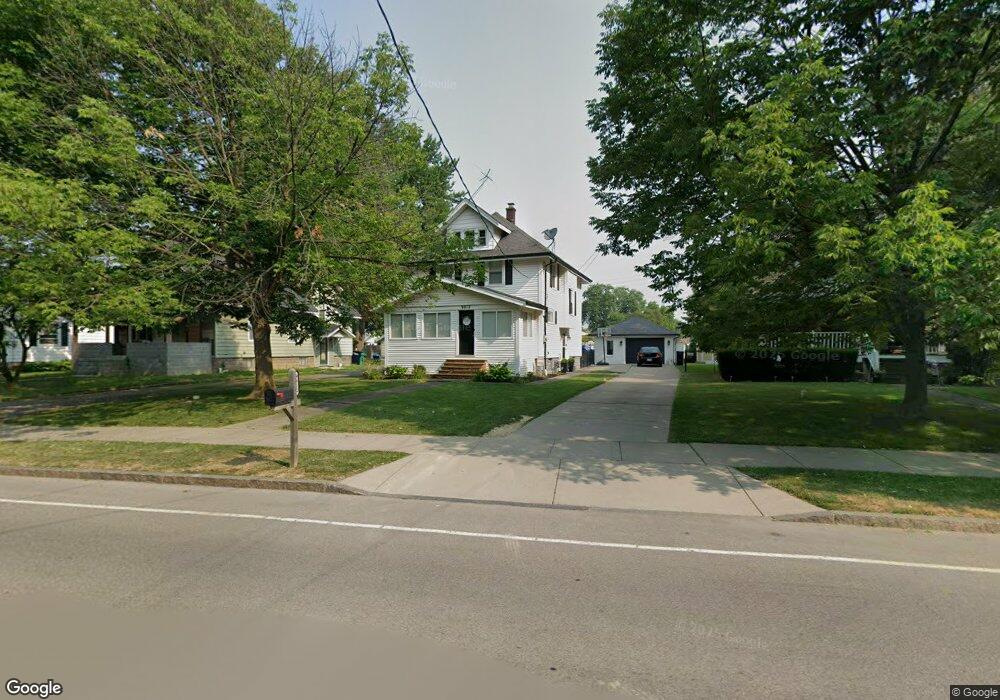
9812 Cayuga Dr Niagara Falls, NY 14304
LaSalle NeighborhoodEstimated Value: $223,000 - $277,000
4
Beds
1
Bath
1,474
Sq Ft
$168/Sq Ft
Est. Value
About This Home
This home is located at 9812 Cayuga Dr, Niagara Falls, NY 14304 and is currently estimated at $247,141, approximately $167 per square foot. 9812 Cayuga Dr is a home located in Niagara County with nearby schools including Niagara Falls High School, Christ the King Preparatory Academy, and Catholic Academy Of Niagara Falls - Elementary.
Ownership History
Date
Name
Owned For
Owner Type
Purchase Details
Closed on
Mar 2, 2016
Sold by
Merwin Michele A and Merwin Danny L
Bought by
Thomas Nicholas A and Thomas Jessica L
Current Estimated Value
Purchase Details
Closed on
May 15, 2008
Sold by
Milleville Verna A Estate
Bought by
Thomas Nicholas
Home Financials for this Owner
Home Financials are based on the most recent Mortgage that was taken out on this home.
Original Mortgage
$87,850
Interest Rate
5.91%
Mortgage Type
New Conventional
Create a Home Valuation Report for This Property
The Home Valuation Report is an in-depth analysis detailing your home's value as well as a comparison with similar homes in the area
Home Values in the Area
Average Home Value in this Area
Purchase History
| Date | Buyer | Sale Price | Title Company |
|---|---|---|---|
| Thomas Nicholas A | $310,000 | None Available | |
| Thomas Nicholas | $90,000 | Alan Roscetti |
Source: Public Records
Mortgage History
| Date | Status | Borrower | Loan Amount |
|---|---|---|---|
| Previous Owner | Thomas Nicholas | $87,850 |
Source: Public Records
Tax History Compared to Growth
Tax History
| Year | Tax Paid | Tax Assessment Tax Assessment Total Assessment is a certain percentage of the fair market value that is determined by local assessors to be the total taxable value of land and additions on the property. | Land | Improvement |
|---|---|---|---|---|
| 2024 | $4,818 | $78,700 | $11,000 | $67,700 |
| 2023 | $4,818 | $78,700 | $11,000 | $67,700 |
| 2022 | $2,302 | $78,700 | $11,000 | $67,700 |
| 2021 | $2,302 | $78,700 | $11,000 | $67,700 |
| 2020 | $1,527 | $78,700 | $11,000 | $67,700 |
| 2019 | $1,854 | $78,700 | $11,000 | $67,700 |
| 2018 | $2,261 | $78,700 | $11,000 | $67,700 |
| 2017 | $1,854 | $78,700 | $11,000 | $67,700 |
| 2016 | $1,907 | $78,700 | $11,000 | $67,700 |
| 2015 | -- | $78,700 | $11,000 | $67,700 |
| 2014 | -- | $78,700 | $11,000 | $67,700 |
Source: Public Records
Map
Nearby Homes