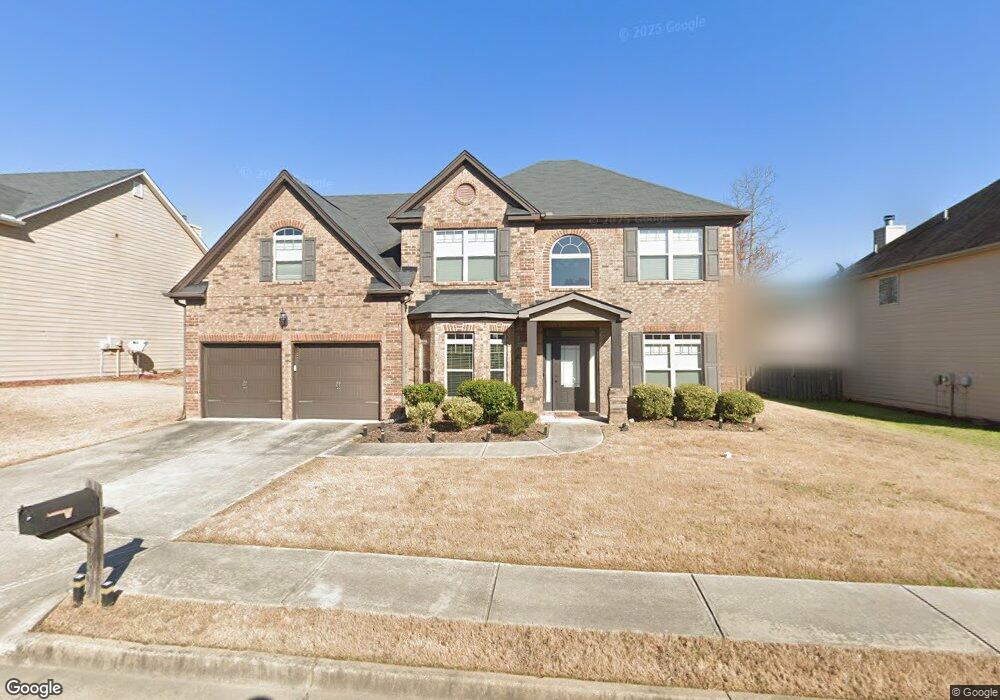
9814 Braxley Way Unit LOT 6 Jonesboro, GA 30238
Estimated Value: $371,694 - $441,000
5
Beds
3
Baths
2,993
Sq Ft
$132/Sq Ft
Est. Value
About This Home
This home is located at 9814 Braxley Way Unit LOT 6, Jonesboro, GA 30238 and is currently estimated at $395,674, approximately $132 per square foot. 9814 Braxley Way Unit LOT 6 is a home located in Clayton County with nearby schools including Kemp Primary School, Kemp Elementary School, and Mundys Mill Middle School.
Ownership History
Date
Name
Owned For
Owner Type
Purchase Details
Closed on
May 14, 2024
Sold by
Mccarty Anika
Bought by
Jones Michael A
Current Estimated Value
Home Financials for this Owner
Home Financials are based on the most recent Mortgage that was taken out on this home.
Original Mortgage
$303,200
Outstanding Balance
$299,123
Interest Rate
7.1%
Mortgage Type
New Conventional
Estimated Equity
$96,551
Purchase Details
Closed on
Feb 14, 2018
Sold by
Rolling Leetamu Darnell
Bought by
Rolling Anika M
Purchase Details
Closed on
Apr 30, 2014
Sold by
Rolling Anika M
Bought by
Rolling Anika M and Rolling Leetamu Darnell
Home Financials for this Owner
Home Financials are based on the most recent Mortgage that was taken out on this home.
Original Mortgage
$184,594
Interest Rate
4.25%
Mortgage Type
FHA
Purchase Details
Closed on
Nov 5, 2013
Sold by
Skyview Media Inc
Bought by
Jefferson Homes Inc
Create a Home Valuation Report for This Property
The Home Valuation Report is an in-depth analysis detailing your home's value as well as a comparison with similar homes in the area
Home Values in the Area
Average Home Value in this Area
Purchase History
| Date | Buyer | Sale Price | Title Company |
|---|---|---|---|
| Jones Michael A | $379,000 | -- | |
| Rolling Anika M | -- | -- | |
| Rolling Anika M | -- | -- | |
| Holling Anika M | $188,000 | -- | |
| Jefferson Homes Inc | $37,500 | -- |
Source: Public Records
Mortgage History
| Date | Status | Borrower | Loan Amount |
|---|---|---|---|
| Open | Jones Michael A | $303,200 | |
| Previous Owner | Holling Anika M | $184,594 |
Source: Public Records
Tax History Compared to Growth
Tax History
| Year | Tax Paid | Tax Assessment Tax Assessment Total Assessment is a certain percentage of the fair market value that is determined by local assessors to be the total taxable value of land and additions on the property. | Land | Improvement |
|---|---|---|---|---|
| 2024 | $5,924 | $160,880 | $10,400 | $150,480 |
| 2023 | $5,303 | $146,880 | $10,400 | $136,480 |
| 2022 | $3,655 | $102,160 | $10,400 | $91,760 |
| 2021 | $3,341 | $93,640 | $10,400 | $83,240 |
| 2020 | $3,082 | $86,103 | $10,400 | $75,703 |
| 2019 | $3,140 | $86,400 | $9,600 | $76,800 |
| 2018 | $3,579 | $87,231 | $9,600 | $77,631 |
| 2017 | $3,381 | $82,152 | $9,600 | $72,552 |
| 2016 | $3,381 | $82,152 | $9,600 | $72,552 |
| 2015 | $3,047 | $0 | $0 | $0 |
| 2014 | $1,993 | $49,148 | $9,600 | $39,548 |
Source: Public Records
Map
Nearby Homes
- 1157 Mundys Mill Rd
- 1131 Orr Rd
- 6648 Coker Way
- 6637 Chason Woods Ct
- 6632 Chason Woods Ct
- 9620 Carolina Dr
- 1506 Mundys Mill Rd
- 9997 Point View Dr
- 9463 Rollinghills Dr
- 1253 Todiway Ct
- 1358 Riverstone Rd Unit 102
- 9531 Winding Way Ln
- 9468 Briarwood Ln
- 1254 Meadowbrook Drive Unit#179
- 1256 Riverstone Rd
- 1274 Riverstone Rd
- 1262 Riverstone Rd
- 1234 Riverstone Rd
- 9814 Braxley Way
- 9808 Braxley Way Unit LOT 5
- 9808 Braxley Way
- 9820 Braxley Way Unit LOT 7
- 9820 Braxley Way
- 0 Braxley Way Unit 9011033
- 0 Braxley Way Unit 8745112
- 9797 Owen Pkwy Unit 1
- 9802 Braxley Way Unit LOT 4
- 9802 Braxley Way
- 9826 Braxley Way
- 9826 Braxley Way Unit LOT 27
- 9826 Braxley Way Unit LOT 8
- 9815 Braxley Way Unit LOT 22
- 9815 Braxley Way
- 9809 Braxley Way
- 9783 Owen Pkwy
- 9821 Braxley Way
- 9809 Owen Pkwy Unit 1
- 9809 Owen Pkwy Unit 5