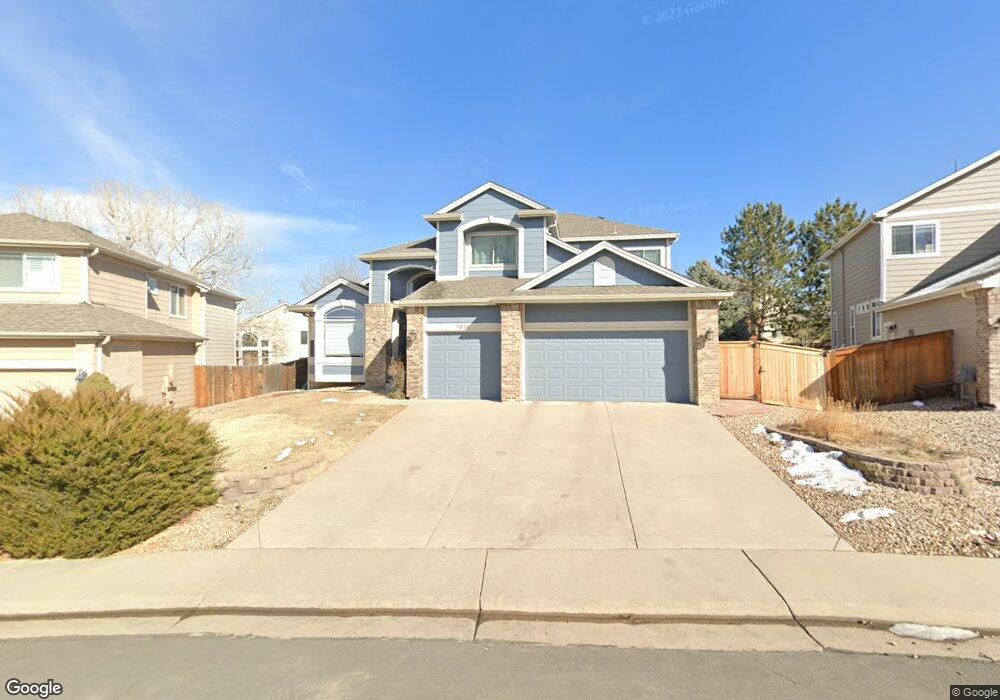
9814 Reed St Westminster, CO 80021
Westcliff & Cambridge NeighborhoodEstimated Value: $795,756 - $881,000
4
Beds
4
Baths
3,641
Sq Ft
$229/Sq Ft
Est. Value
About This Home
This home is located at 9814 Reed St, Westminster, CO 80021 and is currently estimated at $834,439, approximately $229 per square foot. 9814 Reed St is a home located in Jefferson County with nearby schools including Semper Elementary School, Mandalay Middle School, and Standley Lake High School.
Ownership History
Date
Name
Owned For
Owner Type
Purchase Details
Closed on
Sep 12, 2012
Sold by
Ta Thach Q and Ta Anne N
Bought by
Nelson Timothy B and Nelson Mary F
Current Estimated Value
Home Financials for this Owner
Home Financials are based on the most recent Mortgage that was taken out on this home.
Original Mortgage
$314,500
Outstanding Balance
$217,826
Interest Rate
3.59%
Mortgage Type
New Conventional
Estimated Equity
$616,613
Purchase Details
Closed on
May 7, 1998
Sold by
Anhorn Ronald and Anhorn Trudy A
Bought by
Ta Thach Q and Ta Anne N
Home Financials for this Owner
Home Financials are based on the most recent Mortgage that was taken out on this home.
Original Mortgage
$225,000
Interest Rate
7.09%
Purchase Details
Closed on
Oct 7, 1996
Sold by
D R Horton Inc
Bought by
Anhorn Ronald and Anhorn Trudy A
Home Financials for this Owner
Home Financials are based on the most recent Mortgage that was taken out on this home.
Original Mortgage
$186,000
Interest Rate
8.09%
Create a Home Valuation Report for This Property
The Home Valuation Report is an in-depth analysis detailing your home's value as well as a comparison with similar homes in the area
Home Values in the Area
Average Home Value in this Area
Purchase History
| Date | Buyer | Sale Price | Title Company |
|---|---|---|---|
| Nelson Timothy B | $414,500 | Ats | |
| Ta Thach Q | $266,000 | First American | |
| Anhorn Ronald | $221,000 | Land Title |
Source: Public Records
Mortgage History
| Date | Status | Borrower | Loan Amount |
|---|---|---|---|
| Open | Nelson Timothy B | $314,500 | |
| Previous Owner | Ta Thach Q | $225,000 | |
| Previous Owner | Anhorn Ronald | $186,000 |
Source: Public Records
Tax History
| Year | Tax Paid | Tax Assessment Tax Assessment Total Assessment is a certain percentage of the fair market value that is determined by local assessors to be the total taxable value of land and additions on the property. | Land | Improvement |
|---|---|---|---|---|
| 2024 | $3,909 | $48,496 | $16,604 | $31,892 |
| 2023 | $3,909 | $48,496 | $16,604 | $31,892 |
| 2022 | $3,178 | $38,580 | $10,194 | $28,386 |
| 2021 | $3,225 | $39,690 | $10,487 | $29,203 |
| 2020 | $3,082 | $38,102 | $10,696 | $27,406 |
| 2019 | $3,033 | $38,102 | $10,696 | $27,406 |
| 2018 | $2,876 | $34,886 | $8,415 | $26,471 |
| 2017 | $2,590 | $34,886 | $8,415 | $26,471 |
| 2016 | $2,626 | $32,935 | $6,794 | $26,141 |
| 2015 | $2,334 | $32,935 | $6,794 | $26,141 |
| 2014 | $2,334 | $27,223 | $6,408 | $20,815 |
Source: Public Records
Map
Nearby Homes
- 9772 Quay Loop
- 9796 Teller Ct
- 9716 Teller Ct
- 9679 Otis Dr
- 6567 W 96th Dr
- 10245 Wadsworth Blvd
- 6468 W 96th Place
- 9330 Pierce St
- 7820 W 96th Ave
- 9338 Pierce St
- 9221 Pierce St
- 9409 Ingalls St
- 9251 Wadsworth Blvd
- 9312 Kendall St
- 9212 Lamar St
- 9195 Pierce St Unit 5
- 9195 Pierce St Unit 1
- 9195 Pierce St Unit 7
- 9195 Pierce St Unit 3
- 5625 W 96th Place
Your Personal Tour Guide
Ask me questions while you tour the home.