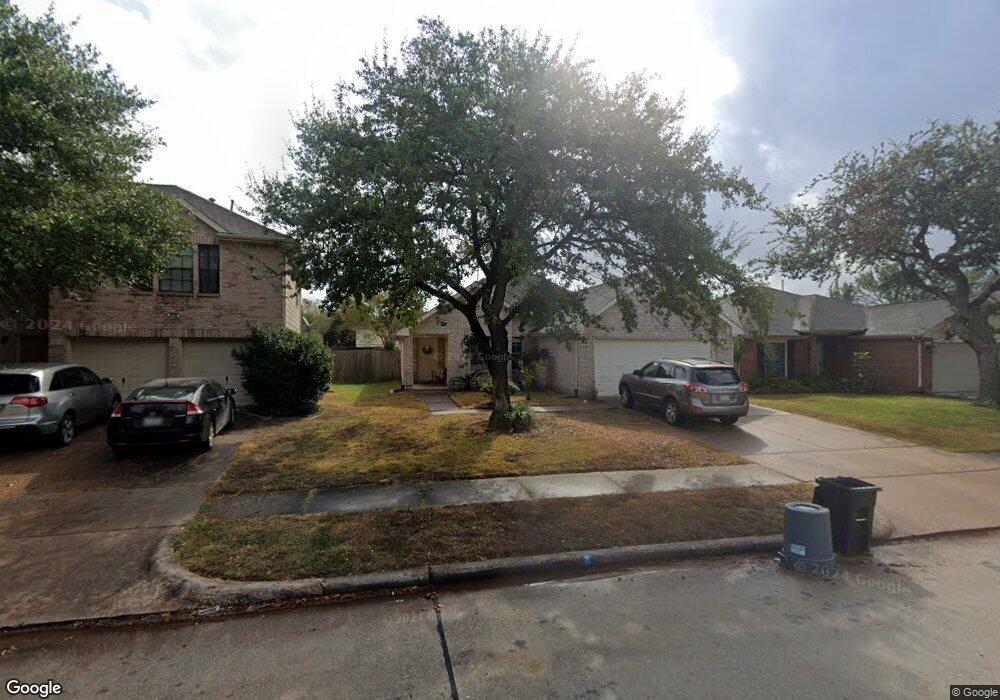
9814 Revelstoke Dr Houston, TX 77086
North Houston NeighborhoodEstimated Value: $242,000 - $259,000
3
Beds
2
Baths
1,881
Sq Ft
$133/Sq Ft
Est. Value
About This Home
This home is located at 9814 Revelstoke Dr, Houston, TX 77086 and is currently estimated at $249,994, approximately $132 per square foot. 9814 Revelstoke Dr is a home located in Harris County with nearby schools including Kujawa EC/Pre-K/K School, Wilson Intermediate School, and Shotwell Middle School.
Ownership History
Date
Name
Owned For
Owner Type
Purchase Details
Closed on
Mar 30, 2017
Sold by
Mai Son and Mai Thu
Bought by
Nguyen Hanna
Current Estimated Value
Home Financials for this Owner
Home Financials are based on the most recent Mortgage that was taken out on this home.
Original Mortgage
$125,100
Outstanding Balance
$103,931
Interest Rate
4.15%
Mortgage Type
New Conventional
Estimated Equity
$146,063
Purchase Details
Closed on
Aug 1, 2013
Sold by
Gardner Craig D and Gardner Simone A
Bought by
Mai Son and Mai Thli
Purchase Details
Closed on
Jun 30, 2000
Sold by
Kaufman & Broad Lone Star Lp
Bought by
Gardner Craig D and Gardner Simone A
Home Financials for this Owner
Home Financials are based on the most recent Mortgage that was taken out on this home.
Original Mortgage
$102,534
Interest Rate
8.56%
Mortgage Type
VA
Create a Home Valuation Report for This Property
The Home Valuation Report is an in-depth analysis detailing your home's value as well as a comparison with similar homes in the area
Home Values in the Area
Average Home Value in this Area
Purchase History
| Date | Buyer | Sale Price | Title Company |
|---|---|---|---|
| Nguyen Hanna | -- | None Available | |
| Mai Son | -- | Stewart Title | |
| Gardner Craig D | -- | -- |
Source: Public Records
Mortgage History
| Date | Status | Borrower | Loan Amount |
|---|---|---|---|
| Open | Nguyen Hanna | $125,100 | |
| Previous Owner | Gardner Craig D | $102,534 |
Source: Public Records
Tax History Compared to Growth
Tax History
| Year | Tax Paid | Tax Assessment Tax Assessment Total Assessment is a certain percentage of the fair market value that is determined by local assessors to be the total taxable value of land and additions on the property. | Land | Improvement |
|---|---|---|---|---|
| 2025 | $6,015 | $253,146 | $34,414 | $218,732 |
| 2024 | $6,015 | $260,082 | $34,414 | $225,668 |
| 2023 | $6,015 | $260,082 | $35,357 | $224,725 |
| 2022 | $5,710 | $234,591 | $27,198 | $207,393 |
| 2021 | $4,597 | $189,289 | $27,198 | $162,091 |
| 2020 | $5,038 | $186,625 | $27,198 | $159,427 |
| 2019 | $4,501 | $160,348 | $18,767 | $141,581 |
| 2018 | $2,081 | $144,903 | $18,767 | $126,136 |
| 2017 | $3,677 | $135,865 | $16,862 | $119,003 |
| 2016 | $3,677 | $135,865 | $16,862 | $119,003 |
| 2015 | $2,759 | $117,631 | $16,862 | $100,769 |
| 2014 | $2,759 | $101,825 | $16,862 | $84,963 |
Source: Public Records
Map
Nearby Homes
- 6706 Redding Springs Ln
- 0 Tomball Pkwy
- 10730 Antoine Dr
- 6411 Halstead Meadows Cir
- 7011 Lower Arrow Dr
- 6830 Desert Rose Ln
- 6703 Deer Ridge Ln
- 9815 Lonsford Dr
- 10214 Trade Winds Dr
- 6822 Dusty Dawn Dr
- 12610 Twilight Bend Ct
- 10306 Jillana Kaye Dr
- 5914 Stirring Winds Ln
- 6911 Silver Star Dr
- 3265 Frick Rd
- 6502 Trail Valley Way
- 00 Romona Blvd
- 7307 Silver Star Dr
- 10307 Bammel North Houston Rd
- 7302 Seton Lake Dr
- 9810 Revelstoke Dr
- 9818 Revelstoke Dr
- 9806 Revelstoke Dr
- 9827 Revelstoke Dr
- 9822 Revelstoke Dr
- 9802 Revelstoke Dr
- 6614 Lower Arrow Dr
- 9826 Revelstoke Dr
- 9831 Revelstoke Dr
- 6559 Mccharen Ct
- 6555 Mccharen Ct
- 6618 Lower Arrow Dr
- 6556 Mccharen Ct
- 9830 Revelstoke Dr
- 9835 Revelstoke Dr
- 6622 Lower Arrow Dr
- 6554 Bryant Park Ct
- 9834 Revelstoke Dr
- 6607 Lower Arrow Dr
- 6603 Lower Arrow Dr