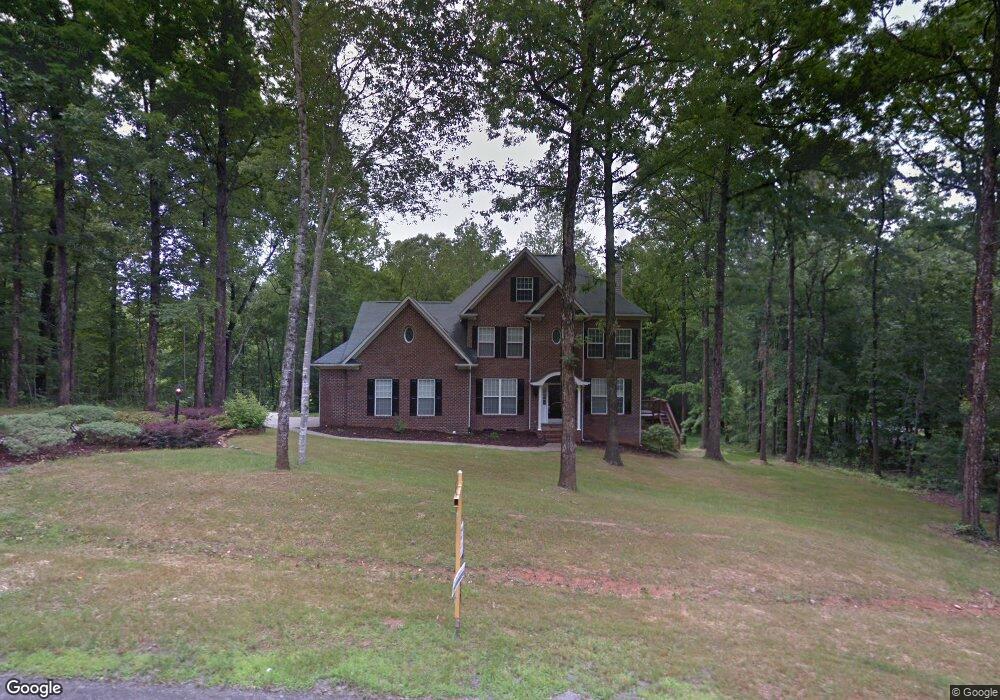
9816 Tallwood Dr Indian Trail, NC 28079
Estimated Value: $626,694 - $737,000
3
Beds
3
Baths
2,517
Sq Ft
$271/Sq Ft
Est. Value
About This Home
This home is located at 9816 Tallwood Dr, Indian Trail, NC 28079 and is currently estimated at $681,674, approximately $270 per square foot. 9816 Tallwood Dr is a home located in Union County with nearby schools including Fairview Elementary School, Piedmont Middle School, and Piedmont High School.
Ownership History
Date
Name
Owned For
Owner Type
Purchase Details
Closed on
Jun 23, 2016
Sold by
Mull Jared N and Mull Jaime M
Bought by
Maul Martin and Maul Leah
Current Estimated Value
Home Financials for this Owner
Home Financials are based on the most recent Mortgage that was taken out on this home.
Original Mortgage
$287,200
Outstanding Balance
$228,579
Interest Rate
3.57%
Mortgage Type
New Conventional
Estimated Equity
$453,095
Purchase Details
Closed on
Jul 16, 2015
Sold by
Gunter Glenn O and Gunter Connie K
Bought by
Mull Jared N and Mull Jamie M
Home Financials for this Owner
Home Financials are based on the most recent Mortgage that was taken out on this home.
Original Mortgage
$270,750
Interest Rate
3.92%
Mortgage Type
New Conventional
Purchase Details
Closed on
Jun 29, 1998
Sold by
Woodman Jeffrey J and Woodman Karen K
Bought by
Gunter Glenn O and Gunter Connie K
Home Financials for this Owner
Home Financials are based on the most recent Mortgage that was taken out on this home.
Original Mortgage
$242,250
Interest Rate
7.21%
Create a Home Valuation Report for This Property
The Home Valuation Report is an in-depth analysis detailing your home's value as well as a comparison with similar homes in the area
Home Values in the Area
Average Home Value in this Area
Purchase History
| Date | Buyer | Sale Price | Title Company |
|---|---|---|---|
| Maul Martin | $359,000 | None Available | |
| Mull Jared N | $285,000 | Attorney | |
| Gunter Glenn O | $255,000 | -- |
Source: Public Records
Mortgage History
| Date | Status | Borrower | Loan Amount |
|---|---|---|---|
| Open | Maul Martin | $287,200 | |
| Previous Owner | Mull Jared N | $270,750 | |
| Previous Owner | Gunter Glenn O | $242,250 |
Source: Public Records
Tax History Compared to Growth
Tax History
| Year | Tax Paid | Tax Assessment Tax Assessment Total Assessment is a certain percentage of the fair market value that is determined by local assessors to be the total taxable value of land and additions on the property. | Land | Improvement |
|---|---|---|---|---|
| 2024 | $2,496 | $373,300 | $89,700 | $283,600 |
| 2023 | $2,457 | $373,300 | $89,700 | $283,600 |
| 2022 | $2,457 | $373,300 | $89,700 | $283,600 |
| 2021 | $2,460 | $373,300 | $89,700 | $283,600 |
| 2020 | $2,618 | $326,160 | $71,460 | $254,700 |
| 2019 | $2,549 | $326,160 | $71,460 | $254,700 |
| 2018 | $0 | $326,160 | $71,460 | $254,700 |
| 2017 | $2,654 | $318,800 | $71,500 | $247,300 |
| 2016 | $2,607 | $318,760 | $71,460 | $247,300 |
| 2015 | $2,639 | $318,760 | $71,460 | $247,300 |
| 2014 | $2,481 | $351,950 | $106,100 | $245,850 |
Source: Public Records
Map
Nearby Homes
- 15670 Bethel Avenue Extension
- 417 Foxglove Ln
- 315 Brief Rd W
- 109 Brief Rd W
- 9515 Concord Hwy
- Lot 10 Duck Creek Fa Duck Creek Ln
- 406 Duck Creek Ln
- 15655 Highway 601
- 12011 Brief Rd
- 4112 Mcmanus Rd Unit 2
- 11925 Brief Rd
- 8913 Gosnell Dr
- TBD Machado Dr
- 8809 Blaydon Dr
- 3305 Drake Rd
- 610 Old Dutch Rd W
- 10815 Hadrians Walk Ct
- 2224 Pope Rd
- 10624 Wood Meadow Dr
- 2622 Cimarron Cir
- 9812 Tallwood Dr
- 9812 Tallwood Dr Unit 21
- 9820 Tallwood Dr
- 9815 Tallwood Dr
- 9824 Tallwood Dr
- 9818 Running Cedar Ln
- 9808 Tallwood Dr
- 9807 Tallwood Dr
- 9906 Running Cedar Ln
- 9812 Running Cedar Ln
- 9910 Running Cedar Ln
- 9804 Tallwood Dr
- 9827 Thornridge Dr
- 9817 Thornridge Dr
- 9805 Tallwood Dr
- 9831 Thornridge Dr
- 9901 Running Cedar Ln
- 9817 Running Cedar Ln
- 9808 Running Cedar Ln
- 9813 Thornridge Dr