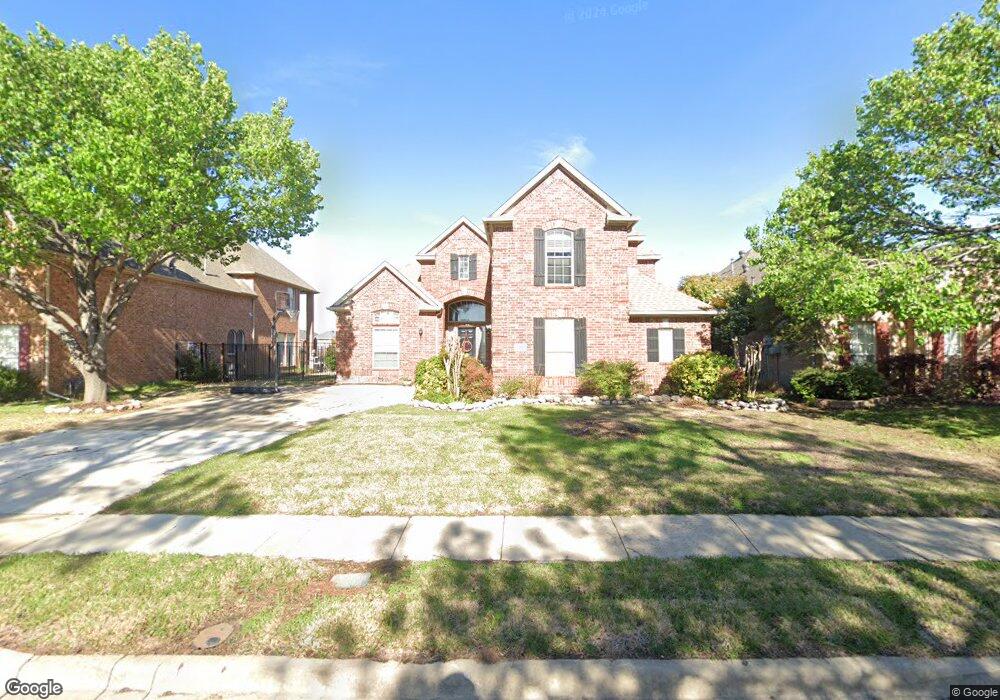
9817 Waterview Pkwy Rowlett, TX 75089
Waterview NeighborhoodEstimated Value: $546,000 - $706,000
3
Beds
3
Baths
3,388
Sq Ft
$175/Sq Ft
Est. Value
About This Home
This home is located at 9817 Waterview Pkwy, Rowlett, TX 75089 and is currently estimated at $592,360, approximately $174 per square foot. 9817 Waterview Pkwy is a home located in Dallas County with nearby schools including Education Center International Academy Rowlett, Wesleyan Christian Academy, and Providence Academy.
Ownership History
Date
Name
Owned For
Owner Type
Purchase Details
Closed on
Aug 12, 2014
Sold by
Lovern Julie M and Rios Julie Marie
Bought by
Cabaniss Charles D and Cabaniss Damita W
Current Estimated Value
Home Financials for this Owner
Home Financials are based on the most recent Mortgage that was taken out on this home.
Original Mortgage
$246,500
Outstanding Balance
$188,306
Interest Rate
4.16%
Mortgage Type
New Conventional
Estimated Equity
$404,054
Purchase Details
Closed on
Aug 1, 2014
Sold by
Lovern Ronald K
Bought by
Lovern Julie M and Rios Julie Marie
Home Financials for this Owner
Home Financials are based on the most recent Mortgage that was taken out on this home.
Original Mortgage
$246,500
Outstanding Balance
$188,306
Interest Rate
4.16%
Mortgage Type
New Conventional
Estimated Equity
$404,054
Purchase Details
Closed on
May 30, 2002
Sold by
U S Home Of Texas Inc
Bought by
Lovern Ronald K and Lovern Julie M
Home Financials for this Owner
Home Financials are based on the most recent Mortgage that was taken out on this home.
Original Mortgage
$181,247
Interest Rate
6.92%
Create a Home Valuation Report for This Property
The Home Valuation Report is an in-depth analysis detailing your home's value as well as a comparison with similar homes in the area
Home Values in the Area
Average Home Value in this Area
Purchase History
| Date | Buyer | Sale Price | Title Company |
|---|---|---|---|
| Cabaniss Charles D | -- | Lawyers Title | |
| Lovern Julie M | -- | Lawyers Title | |
| Lovern Ronald K | -- | -- |
Source: Public Records
Mortgage History
| Date | Status | Borrower | Loan Amount |
|---|---|---|---|
| Open | Cabaniss Charles D | $246,500 | |
| Previous Owner | Lovern Ronald K | $181,247 |
Source: Public Records
Tax History Compared to Growth
Tax History
| Year | Tax Paid | Tax Assessment Tax Assessment Total Assessment is a certain percentage of the fair market value that is determined by local assessors to be the total taxable value of land and additions on the property. | Land | Improvement |
|---|---|---|---|---|
| 2025 | $9,705 | $530,190 | $121,500 | $408,690 |
| 2024 | $9,705 | $586,360 | $121,500 | $464,860 |
| 2023 | $9,705 | $557,300 | $121,500 | $435,800 |
| 2022 | $9,767 | $403,070 | $121,500 | $281,570 |
| 2021 | $9,448 | $360,930 | $77,000 | $283,930 |
| 2020 | $8,973 | $339,740 | $74,250 | $265,490 |
| 2019 | $9,320 | $324,340 | $74,250 | $250,090 |
| 2018 | $9,386 | $324,340 | $74,250 | $250,090 |
| 2017 | $8,821 | $303,990 | $74,250 | $229,740 |
| 2016 | $8,821 | $303,990 | $74,250 | $229,740 |
| 2015 | $5,215 | $282,460 | $74,250 | $208,210 |
| 2014 | $5,215 | $211,650 | $78,600 | $133,050 |
Source: Public Records
Map
Nearby Homes
- 10013 Waterview Pkwy
- 9506 Glenshee Dr
- 10210 Links Fairway Dr
- 10205 Broadmoor Ln
- 10014 Fairway Vista Dr
- 10217 Broadmoor Ln
- 9610 Broadmoor Ln
- 10410 Augusta Ln
- 10302 Fairway Vista Dr
- 9213 Royal Burgess Dr
- 10606 Greenbriar Ln
- 10702 Augusta Ln
- 9201 Royal Burgess Dr
- 10706 Augusta Ln
- 9213 Inverness Dr
- 9320 Lamar St
- 9224 Lamar St
- 9212 Lamar St
- 6300 Trezevant St
- 9205 Lamar St
- 9901 Waterview Pkwy
- 9813 Waterview Pkwy
- 9809 Waterview Pkwy
- 9905 Waterview Pkwy
- 9805 Waterview Pkwy
- 9909 Waterview Pkwy
- 9818 Waterview Pkwy
- 9814 Waterview Pkwy
- 9902 Waterview Pkwy
- 9801 Waterview Pkwy
- 9810 Waterview Pkwy
- 8906 Edinburgh Ln
- 9906 Waterview Pkwy
- 8902 Edinburgh Ln
- 9913 Waterview Pkwy
- 9806 Waterview Pkwy
- 9818 Glenshee Dr
- 9822 Glenshee Dr
- 9814 Glenshee Dr
- 9902 Glenshee Dr