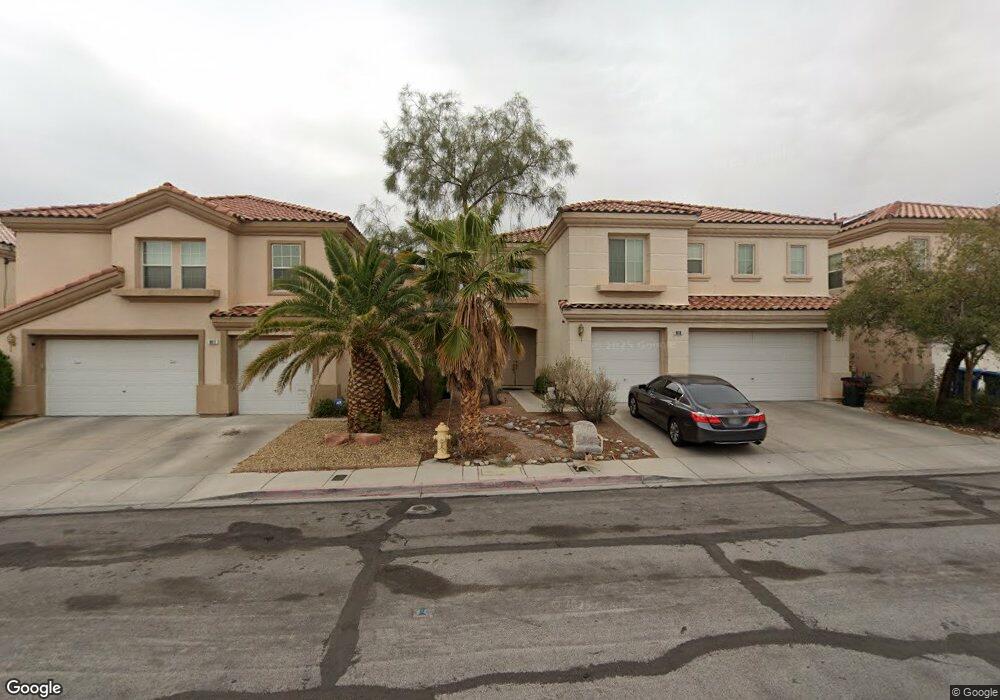
9819 Cornwall Crossing Ln Las Vegas, NV 89147
Rancho Viejo NeighborhoodEstimated Value: $616,000 - $652,000
4
Beds
3
Baths
3,036
Sq Ft
$207/Sq Ft
Est. Value
About This Home
This home is located at 9819 Cornwall Crossing Ln, Las Vegas, NV 89147 and is currently estimated at $629,660, approximately $207 per square foot. 9819 Cornwall Crossing Ln is a home located in Clark County with nearby schools including Keith C. & Karen W. Hayes Elementary School, Victoria Fertitta Middle School, and Spring Valley High School.
Ownership History
Date
Name
Owned For
Owner Type
Purchase Details
Closed on
Oct 15, 2003
Sold by
Clearwater Cove Ii Lp
Bought by
Suhadi Susanna
Current Estimated Value
Home Financials for this Owner
Home Financials are based on the most recent Mortgage that was taken out on this home.
Original Mortgage
$201,800
Outstanding Balance
$95,397
Interest Rate
6.4%
Mortgage Type
Stand Alone First
Estimated Equity
$534,263
Purchase Details
Closed on
Jun 17, 2003
Sold by
Clearwater Cove Ii Lp
Bought by
Sudjana Eddy and Sudjana Dewi
Home Financials for this Owner
Home Financials are based on the most recent Mortgage that was taken out on this home.
Original Mortgage
$247,800
Interest Rate
5.53%
Mortgage Type
Unknown
Create a Home Valuation Report for This Property
The Home Valuation Report is an in-depth analysis detailing your home's value as well as a comparison with similar homes in the area
Home Values in the Area
Average Home Value in this Area
Purchase History
| Date | Buyer | Sale Price | Title Company |
|---|---|---|---|
| Suhadi Susanna | $288,349 | Nevada Title Company | |
| Sudjana Eddy | $247,800 | Nevada Title Company |
Source: Public Records
Mortgage History
| Date | Status | Borrower | Loan Amount |
|---|---|---|---|
| Open | Suhadi Susanna | $201,800 | |
| Previous Owner | Sudjana Eddy | $247,800 |
Source: Public Records
Tax History Compared to Growth
Tax History
| Year | Tax Paid | Tax Assessment Tax Assessment Total Assessment is a certain percentage of the fair market value that is determined by local assessors to be the total taxable value of land and additions on the property. | Land | Improvement |
|---|---|---|---|---|
| 2025 | $3,853 | $161,503 | $48,300 | $113,203 |
| 2024 | $3,568 | $161,503 | $48,300 | $113,203 |
| 2023 | $3,568 | $146,246 | $39,200 | $107,046 |
| 2022 | $3,304 | $129,397 | $31,850 | $97,547 |
| 2021 | $3,060 | $124,217 | $31,500 | $92,717 |
| 2020 | $2,838 | $121,205 | $29,400 | $91,805 |
| 2019 | $2,660 | $117,418 | $26,950 | $90,468 |
| 2018 | $2,538 | $108,105 | $21,700 | $86,405 |
| 2017 | $3,184 | $108,572 | $21,000 | $87,572 |
| 2016 | $2,376 | $103,099 | $16,100 | $86,999 |
| 2015 | $2,371 | $83,216 | $12,950 | $70,266 |
| 2014 | $2,302 | $77,738 | $11,550 | $66,188 |
Source: Public Records
Map
Nearby Homes
- 9750 W Cherokee Ave Unit 1
- 9750 Pine Thickett Ave
- 9785 Turtle Head Ct
- 9923 Sierra Canyon Way
- 3580 Teton Hills St
- 9857 Pioneer Ave
- 3769 Tranquility Ridge Ct
- 9993 Lemon Valley Ave
- 3772 S Jensen St
- 3757 Horseshoe Mesa St
- 3390 Syvella Ct
- 9758 Camino Capistrano Ln
- 9587 Windborne Ave
- 3380 Mountain Bluebird St
- 9931 Sparrow Ridge Ave
- 3381 Biscayne Bay Dr
- 9718 Camino Capistrano Ln
- 10017 Oak Creek Canyon Ave
- 3905 Tropical Vine St
- 10059 Oak Creek Canyon Ave
- 9827 Cornwall Crossing Ln
- 9811 Cornwall Crossing Ln
- 9835 Cornwall Crossing Ln
- 9803 Cornwall Crossing Ln
- 9822 W Cherokee Ave
- 9830 W Cherokee Ave
- 9814 W Cherokee Ave
- 9838 W Cherokee Ave
- 9806 W Cherokee Ave
- 9843 Cornwall Crossing Ln
- 9820 Cornwall Crossing Ln
- 9828 Cornwall Crossing Ln
- 9812 Cornwall Crossing Ln
- 9846 W Cherokee Ave
- 9804 Cornwall Crossing Ln
- 9836 Cornwall Crossing Ln
- 9844 Cornwall Crossing Ln
- 9844 Cornwall Crossing Ln Unit n/a
- 3570 Audobon St
- 3578 Audobon St