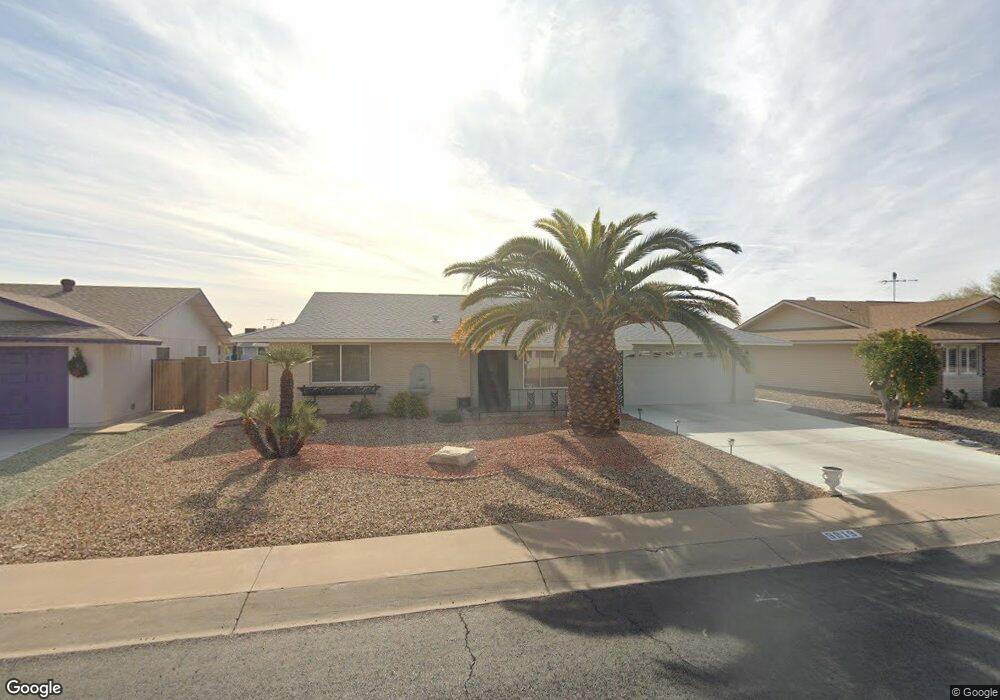
9819 W Forrester Dr Sun City, AZ 85351
Estimated Value: $272,248 - $333,000
2
Beds
2
Baths
1,698
Sq Ft
$180/Sq Ft
Est. Value
About This Home
This home is located at 9819 W Forrester Dr, Sun City, AZ 85351 and is currently estimated at $305,562, approximately $179 per square foot. 9819 W Forrester Dr is a home located in Maricopa County with nearby schools including Desert Mirage Elementary School, Ombudsman - Northwest Charter, and Peoria Accelerated High School.
Ownership History
Date
Name
Owned For
Owner Type
Purchase Details
Closed on
Mar 16, 2023
Sold by
Grooms John D
Bought by
Grooms Family Trust
Current Estimated Value
Purchase Details
Closed on
Jan 11, 2011
Sold by
Grooms Mary Lou
Bought by
Grooms John D and Grooms Mary Lou
Purchase Details
Closed on
Jul 31, 2008
Sold by
Grooms John D
Bought by
Grooms Mary Lou
Purchase Details
Closed on
Jul 28, 2000
Sold by
Burnett Harold J
Bought by
Cadman Robert L and Cadman Percie J
Purchase Details
Closed on
Dec 16, 1996
Sold by
Sass Walter C
Bought by
Bensing Neil A and Bensing Mary Ann
Home Financials for this Owner
Home Financials are based on the most recent Mortgage that was taken out on this home.
Original Mortgage
$81,600
Interest Rate
7.86%
Mortgage Type
New Conventional
Create a Home Valuation Report for This Property
The Home Valuation Report is an in-depth analysis detailing your home's value as well as a comparison with similar homes in the area
Home Values in the Area
Average Home Value in this Area
Purchase History
| Date | Buyer | Sale Price | Title Company |
|---|---|---|---|
| Grooms Family Trust | -- | -- | |
| Grooms John D | -- | None Available | |
| Grooms Mary Lou | -- | First American Title Ins Co | |
| Grooms Mary Lou | $148,500 | First American Title Ins Co | |
| Cadman Robert L | $106,000 | Grand Canyon Title Agency In | |
| Bensing Neil A | $102,000 | Nations Title Insurance |
Source: Public Records
Mortgage History
| Date | Status | Borrower | Loan Amount |
|---|---|---|---|
| Previous Owner | Bensing Neil A | $81,600 |
Source: Public Records
Tax History Compared to Growth
Tax History
| Year | Tax Paid | Tax Assessment Tax Assessment Total Assessment is a certain percentage of the fair market value that is determined by local assessors to be the total taxable value of land and additions on the property. | Land | Improvement |
|---|---|---|---|---|
| 2025 | $1,289 | $14,470 | -- | -- |
| 2024 | $1,165 | $13,781 | -- | -- |
| 2023 | $1,165 | $23,160 | $4,630 | $18,530 |
| 2022 | $1,103 | $18,580 | $3,710 | $14,870 |
| 2021 | $1,127 | $17,610 | $3,520 | $14,090 |
| 2020 | $1,098 | $15,550 | $3,110 | $12,440 |
| 2019 | $1,087 | $14,260 | $2,850 | $11,410 |
| 2018 | $1,050 | $13,020 | $2,600 | $10,420 |
| 2017 | $1,013 | $11,750 | $2,350 | $9,400 |
| 2016 | $951 | $11,260 | $2,250 | $9,010 |
| 2015 | $908 | $10,080 | $2,010 | $8,070 |
Source: Public Records
Map
Nearby Homes
- 9839 W Cedar Dr
- 9851 W Cedar Dr
- 12819 N Sun Valley Dr
- 12635 N Sun Valley Dr
- 9834 W Emberwood Dr
- 12881 N 99th Dr Unit 24C
- 13207 N Branding Iron Dr
- 12418 N Vista Grande Ct
- 12415 N Vista Grande Ct
- 13215 N Lakeforest Dr
- 9955 W Forrester Dr
- 9960 W Forrester Dr
- 13018 N 99th Dr
- 9830 W Teakwood Dr
- 13080 N 99th Dr Unit D
- 12219 N Sun Valley Dr
- 13081 N 100th Ave
- 13233 N 99th Dr Unit 24B
- 13222 N 99th Dr
- 13207 N 98th Ave Unit L
- 9815 W Forrester Dr
- 9821 W Forrester Dr
- 9822 W Cedar Dr
- 9818 W Cedar Dr
- 9826 W Cedar Dr Unit 10A
- 9811 W Forrester Dr
- 9823 W Forrester Dr
- 9814 W Forrester Dr
- 9818 W Forrester Dr
- 9810 W Forrester Dr
- 9830 W Cedar Dr
- 9822 W Forrester Dr
- 9810 W Cedar Dr
- 9807 W Forrester Dr
- 9827 W Forrester Dr
- 9806 W Forrester Dr Unit 10A
- 9834 W Cedar Dr
- 9823 W Cedar Dr
- 9826 W Forrester Dr
- 9806 W Cedar Dr