Estimated Value: $371,417 - $426,000
4
Beds
3
Baths
2,188
Sq Ft
$187/Sq Ft
Est. Value
About This Home
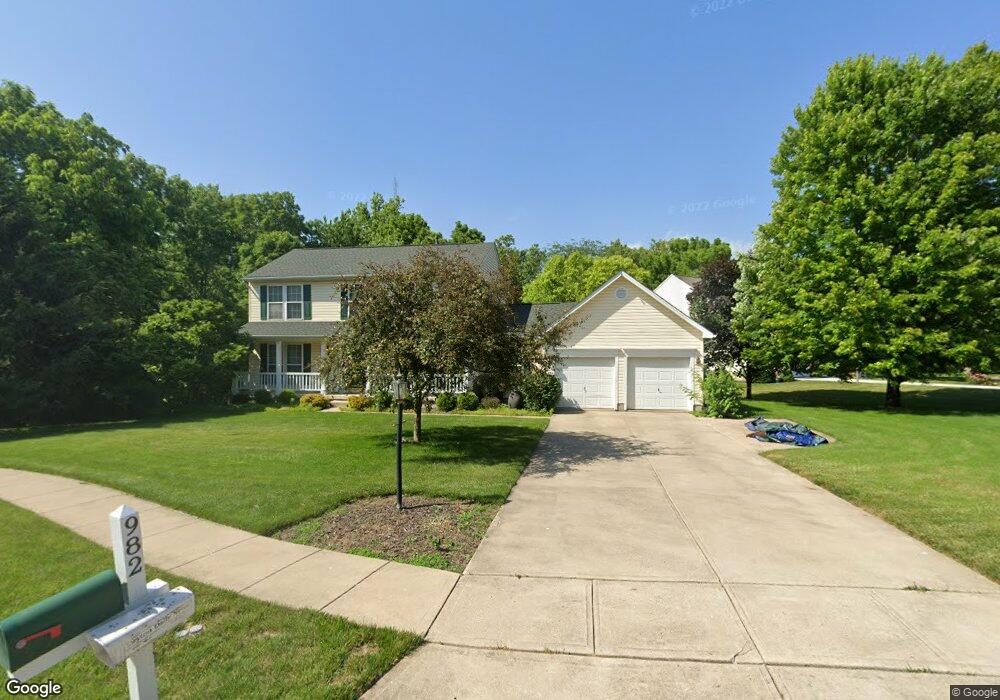
This home is located at 982 Echo Ct, Xenia, OH 45385 and is currently estimated at $408,354, approximately $186 per square foot. 982 Echo Ct is a home located in Greene County with nearby schools including Xenia High School.
Ownership History
Date
Name
Owned For
Owner Type
Purchase Details
Closed on
Sep 12, 2022
Sold by
Jones Alexander M and Jones Susan
Bought by
Jones Alexander M and Jones Susan
Current Estimated Value
Purchase Details
Closed on
May 28, 2021
Sold by
Pastorelle Gary M
Bought by
Jones Alexander M and Minkner Susan
Home Financials for this Owner
Home Financials are based on the most recent Mortgage that was taken out on this home.
Original Mortgage
$289,700
Interest Rate
2.9%
Mortgage Type
New Conventional
Purchase Details
Closed on
Feb 6, 1996
Sold by
Nvr Homes Inc
Bought by
Pastorelle Gary M and Pastorelle A
Home Financials for this Owner
Home Financials are based on the most recent Mortgage that was taken out on this home.
Original Mortgage
$161,050
Interest Rate
7.24%
Mortgage Type
New Conventional
Purchase Details
Closed on
Sep 25, 1995
Bought by
N V R Home Inc
Create a Home Valuation Report for This Property
The Home Valuation Report is an in-depth analysis detailing your home's value as well as a comparison with similar homes in the area
Home Values in the Area
Average Home Value in this Area
Purchase History
| Date | Buyer | Sale Price | Title Company |
|---|---|---|---|
| Jones Alexander M | -- | -- | |
| Jones Alexander M | $305,000 | None Available | |
| Pastorelle Gary M | $169,575 | -- | |
| N V R Home Inc | $32,000 | -- |
Source: Public Records
Mortgage History
| Date | Status | Borrower | Loan Amount |
|---|---|---|---|
| Previous Owner | Jones Alexander M | $289,700 | |
| Previous Owner | Pastorelle Gary M | $161,050 |
Source: Public Records
Tax History Compared to Growth
Tax History
| Year | Tax Paid | Tax Assessment Tax Assessment Total Assessment is a certain percentage of the fair market value that is determined by local assessors to be the total taxable value of land and additions on the property. | Land | Improvement |
|---|---|---|---|---|
| 2024 | $4,318 | $103,570 | $18,300 | $85,270 |
| 2023 | $4,318 | $103,570 | $18,300 | $85,270 |
| 2022 | $3,682 | $75,280 | $11,440 | $63,840 |
| 2021 | $3,298 | $75,280 | $11,440 | $63,840 |
| 2020 | $3,156 | $75,280 | $11,440 | $63,840 |
| 2019 | $3,024 | $68,740 | $10,450 | $58,290 |
| 2018 | $3,035 | $68,740 | $10,450 | $58,290 |
| 2017 | $2,957 | $68,740 | $10,450 | $58,290 |
| 2016 | $2,958 | $66,140 | $10,450 | $55,690 |
| 2015 | $2,966 | $66,140 | $10,450 | $55,690 |
| 2014 | $2,837 | $66,140 | $10,450 | $55,690 |
Source: Public Records
Map
Nearby Homes
- 1056 Eastland Dr
- 1030 Independence Dr
- 1818 Highlander Dr
- 955 Oak Dale Dr
- 1764 Highlander Dr
- 965 Oak Dale Dr
- 1728 Highlander Dr
- 1359 Eagles Way
- 129 Outerview Dr
- 109 Outerview Cir
- 745 Doral Dr
- 428 Wilson Dr
- 15 Sexton Dr
- 610 Saxony Dr
- 513 Redbud Ln
- 167 Beverly Place
- 2537 Ridge Rd
- 289 Hollywood Blvd
- 603 Louise Dr
- 878 N Detroit St
- 1948 Highlander Dr
- 976 Echo Ct
- 1954 Highlander Dr
- 975 Echo Ct
- 1951 Highlander Dr
- 1950 Laddie Ct
- 1960 Highlander Dr
- 1935 Highlander Dr
- 982 Mound Ct
- 1940 Laddie Ct
- 976 Mound Ct
- 1966 Highlander Dr
- 1927 Highlander Dr
- 1965 Highlander Dr
- 1932 Laddie Ct
- 968 Mound Ct
- 1937 Laddie Ct
- 477 Fairway Ln
- 1919 Highlander Dr
- 465 Fairway Ln