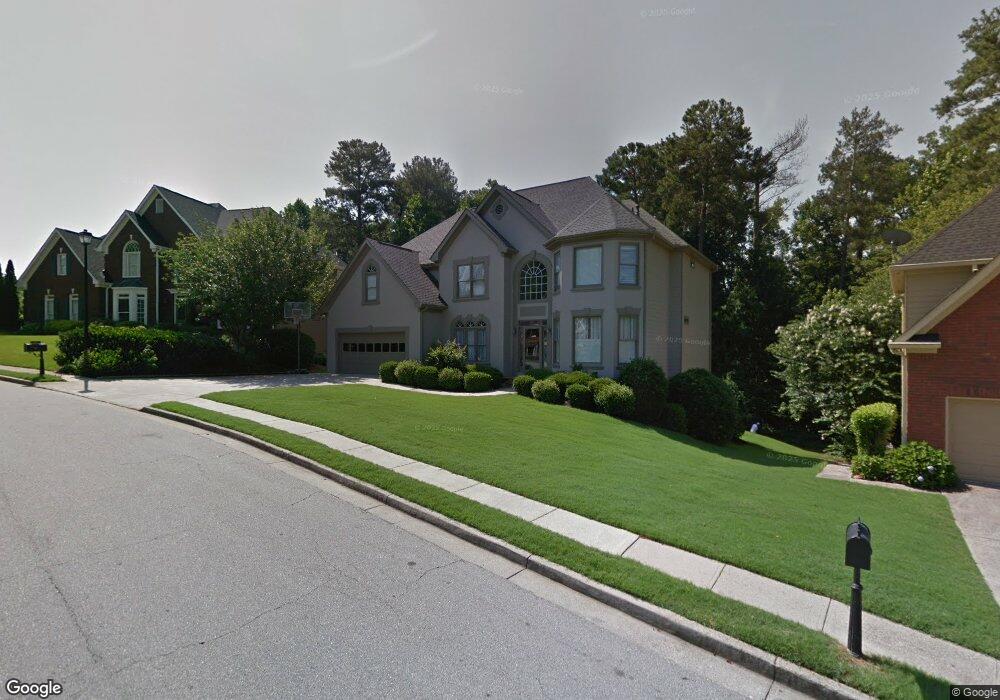
982 Lansfaire Crossing Suwanee, GA 30024
Estimated Value: $662,589 - $778,000
4
Beds
3
Baths
2,766
Sq Ft
$259/Sq Ft
Est. Value
About This Home
This home is located at 982 Lansfaire Crossing, Suwanee, GA 30024 and is currently estimated at $716,897, approximately $259 per square foot. 982 Lansfaire Crossing is a home located in Gwinnett County with nearby schools including Level Creek Elementary School, North Gwinnett Middle School, and North Gwinnett High School.
Ownership History
Date
Name
Owned For
Owner Type
Purchase Details
Closed on
Aug 22, 2014
Sold by
Herchen Beth I
Bought by
Swink David E
Current Estimated Value
Purchase Details
Closed on
Mar 22, 2004
Sold by
Connor Paul G and Connor Julia F
Bought by
Swink David E
Home Financials for this Owner
Home Financials are based on the most recent Mortgage that was taken out on this home.
Original Mortgage
$47,475
Interest Rate
4.96%
Mortgage Type
Unknown
Purchase Details
Closed on
Jul 16, 1996
Sold by
Walters Homes Inc
Bought by
Connor Paul G Julia F
Create a Home Valuation Report for This Property
The Home Valuation Report is an in-depth analysis detailing your home's value as well as a comparison with similar homes in the area
Home Values in the Area
Average Home Value in this Area
Purchase History
| Date | Buyer | Sale Price | Title Company |
|---|---|---|---|
| Swink David E | -- | -- | |
| Swink David E | $316,500 | -- | |
| Connor Paul G Julia F | $237,900 | -- |
Source: Public Records
Mortgage History
| Date | Status | Borrower | Loan Amount |
|---|---|---|---|
| Previous Owner | Swink David E | $47,475 | |
| Previous Owner | Swink David E | $253,200 | |
| Closed | Connor Paul G Julia F | $0 |
Source: Public Records
Tax History Compared to Growth
Tax History
| Year | Tax Paid | Tax Assessment Tax Assessment Total Assessment is a certain percentage of the fair market value that is determined by local assessors to be the total taxable value of land and additions on the property. | Land | Improvement |
|---|---|---|---|---|
| 2025 | $7,021 | $261,680 | $44,080 | $217,600 |
| 2024 | $6,739 | $239,440 | $48,000 | $191,440 |
| 2023 | $6,739 | $224,040 | $48,000 | $176,040 |
| 2022 | $5,993 | $204,600 | $44,000 | $160,600 |
| 2021 | $4,847 | $145,320 | $31,800 | $113,520 |
| 2020 | $4,880 | $145,320 | $31,800 | $113,520 |
| 2019 | $4,511 | $158,760 | $31,800 | $126,960 |
| 2018 | $4,694 | $143,000 | $36,400 | $106,600 |
| 2016 | $4,429 | $130,040 | $36,400 | $93,640 |
| 2015 | $4,348 | $124,280 | $30,400 | $93,880 |
| 2014 | -- | $118,000 | $27,000 | $91,000 |
Source: Public Records
Map
Nearby Homes
- 4265 Lansmoore Crossing
- 1116 Bartlett Trace
- 4339 Lansfaire Terrace Unit 4
- 4270 Laurel Grove Trace
- 1032 Laurel Grove Ct
- 1105 River Laurel Dr
- 4282 Goldfield Trace Unit 4
- 1621 Wellborn Walk
- 1145 River Laurel Dr Unit 3
- 3301 Bennett Creek Ln
- 3170 Bennett Creek Ln
- 3444 Benedict Place
- 858 Red Rock Ct
- 1011 Crofton Landing Unit 1
- 1900 Chattahoochee Run Dr
- 1191 Crofton Landing
- 860 Sunset Park Dr
- 4140 River Bluff Run Way Unit 5B
- 733 Vinebrook Ln Unit 3
- 992 Lansfaire Crossing
- 972 Lansfaire Crossing
- 0 Lansfaire Crossing Unit 7483336
- 0 Lansfaire Crossing Unit 7185364
- 0 Lansfaire Crossing Unit 7033097
- 0 Lansfaire Crossing Unit 8671394
- 0 Lansfaire Crossing Unit 8036797
- 1002 Lansfaire Crossing
- 4295 Lansmoore Crossing
- 962 Lansfaire Crossing
- 977 Lansfaire Crossing
- 987 Lansfaire Crossing
- 4285 Lansmoore Crossing
- 952 Lansfaire Crossing
- 967 Lansfaire Crossing Unit 1
- 4413 Fairecroft Terrace
- 4275 Lansmoore Crossing Unit 5
- 1007 Lansfaire Crossing Unit 1
- 4402 Fairecroft Terrace
- 4402 Fairecroft Terrace Unit 4402