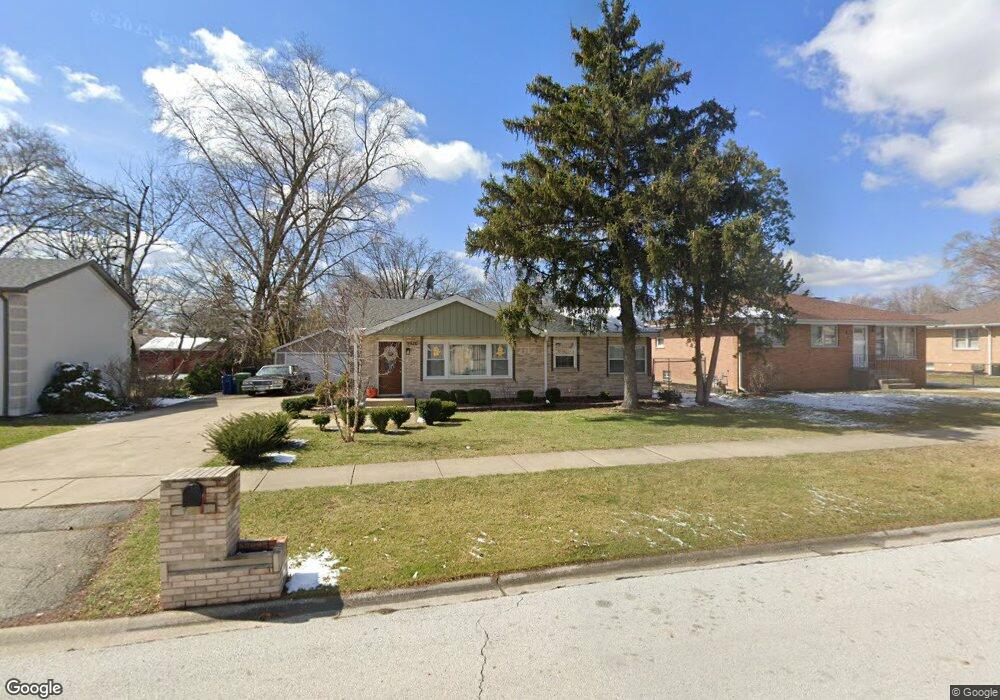
9820 Normandy Ave Oak Lawn, IL 60453
Estimated Value: $242,653 - $289,000
3
Beds
1
Bath
960
Sq Ft
$278/Sq Ft
Est. Value
About This Home
This home is located at 9820 Normandy Ave, Oak Lawn, IL 60453 and is currently estimated at $266,413, approximately $277 per square foot. 9820 Normandy Ave is a home located in Cook County with nearby schools including Ernest F Kolb Elementary School, Simmons Middle School, and Oak Lawn Community High School.
Ownership History
Date
Name
Owned For
Owner Type
Purchase Details
Closed on
Sep 16, 2016
Sold by
Franco Noe
Bought by
Martinez Gabriela and Legis Edilfonso
Current Estimated Value
Home Financials for this Owner
Home Financials are based on the most recent Mortgage that was taken out on this home.
Original Mortgage
$181,649
Outstanding Balance
$147,111
Interest Rate
3.87%
Mortgage Type
FHA
Estimated Equity
$119,302
Purchase Details
Closed on
Nov 17, 2015
Sold by
Us Bank National Association
Bought by
Franco Noe
Home Financials for this Owner
Home Financials are based on the most recent Mortgage that was taken out on this home.
Original Mortgage
$68,000
Interest Rate
5.12%
Mortgage Type
New Conventional
Purchase Details
Closed on
Apr 7, 2015
Sold by
Champion Mortgage Company
Bought by
U S Bank National Association
Purchase Details
Closed on
Mar 27, 2015
Sold by
Pirman Sandra M
Bought by
Champion Mortgage Company
Create a Home Valuation Report for This Property
The Home Valuation Report is an in-depth analysis detailing your home's value as well as a comparison with similar homes in the area
Home Values in the Area
Average Home Value in this Area
Purchase History
| Date | Buyer | Sale Price | Title Company |
|---|---|---|---|
| Martinez Gabriela | $185,000 | Old Republic Title | |
| Franco Noe | $85,000 | Attorney | |
| U S Bank National Association | -- | None Available | |
| Champion Mortgage Company | $237,171 | Stewart Title Company |
Source: Public Records
Mortgage History
| Date | Status | Borrower | Loan Amount |
|---|---|---|---|
| Open | Martinez Gabriela | $181,649 | |
| Previous Owner | Franco Noe | $68,000 |
Source: Public Records
Tax History Compared to Growth
Tax History
| Year | Tax Paid | Tax Assessment Tax Assessment Total Assessment is a certain percentage of the fair market value that is determined by local assessors to be the total taxable value of land and additions on the property. | Land | Improvement |
|---|---|---|---|---|
| 2024 | $1,979 | $6,809 | $1,953 | $4,856 |
| 2023 | $2,198 | $6,809 | $1,953 | $4,856 |
| 2022 | $2,198 | $6,261 | $1,719 | $4,542 |
| 2021 | $2,130 | $6,259 | $1,718 | $4,541 |
| 2020 | $2,087 | $6,259 | $1,718 | $4,541 |
| 2019 | $2,386 | $7,349 | $1,562 | $5,787 |
| 2018 | $2,286 | $7,349 | $1,562 | $5,787 |
| 2017 | $2,319 | $7,349 | $1,562 | $5,787 |
| 2016 | $1,630 | $4,854 | $1,328 | $3,526 |
| 2015 | $1,617 | $4,854 | $1,328 | $3,526 |
| 2014 | $1,603 | $4,854 | $1,328 | $3,526 |
| 2013 | $619 | $5,718 | $1,328 | $4,390 |
Source: Public Records
Map
Nearby Homes
- 9808 Normandy Ave
- 9805 Normandy Ave
- 9725 Normandy Ave
- 6812 98th St
- 6913 97th St
- 7012 98th St Unit 1A
- 7000 Mather Ave Unit 303
- 7000 Mather Ave Unit 101
- 9725 Ridgeland Ave Unit 1N
- 9829 Nottingham Ave Unit 10
- 7048 Oconnell Dr Unit 2E
- 7048 Oconnell Dr Unit 3W
- 6632 W 95th St Unit 2C
- 7100 99th St Unit 204
- 9708 Nottingham Ave Unit 11
- 9812 Nottingham Ave Unit 14A
- 9832 Nottingham Ave Unit 6
- 9832 Nottingham Ave Unit 5
- 10228 Southwest Hwy Unit 1C
- 10248 Southwest Hwy Unit 3D
- 9820 Normandy Ave
- 9820 Normandy Ave
- 9808 Normandy Ave
- 9800 Normandy Ave
- 9800 Normandy Ave
- 9824 Normandy Ave
- 9824 Normandy Ave
- 9809 Rutherford Ave
- 9813 Rutherford Ave
- 9826 Normandy Ave
- 9826 Normandy Ave
- 9805 Rutherford Ave
- 9817 Rutherford Ave
- 9801 Rutherford Ave
- 9801 Rutherford Ave
- 9821 Rutherford Ave
- 9821 Rutherford Ave
- 9805 Normandy Ave
- 9811 Normandy Ave
- 9803 Normandy Ave