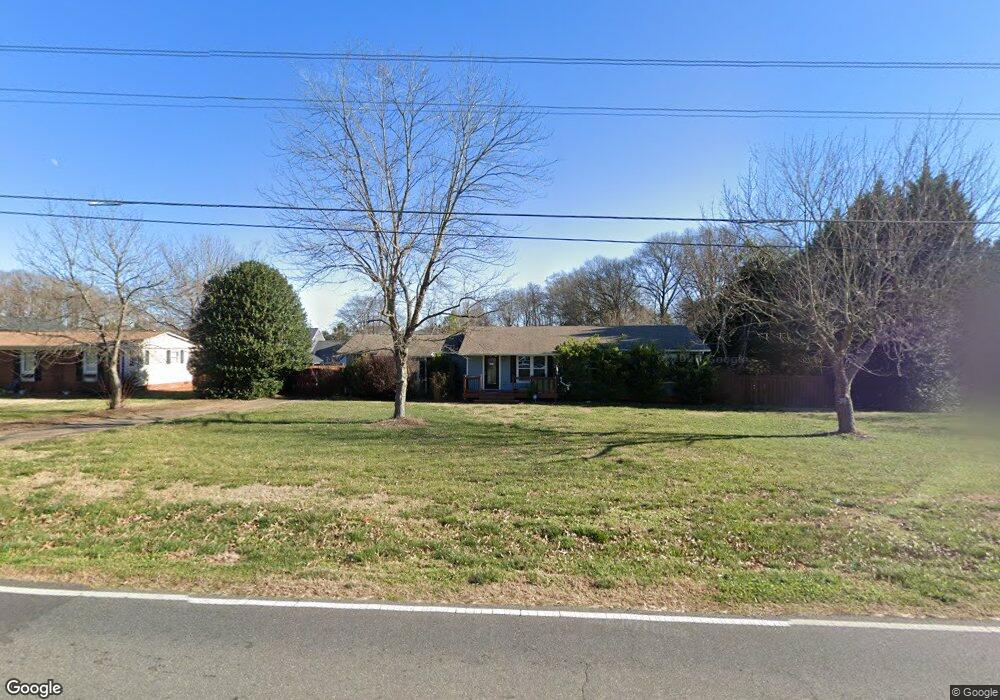
9820 Washam Potts Rd Cornelius, NC 28031
Estimated Value: $481,000 - $550,000
4
Beds
3
Baths
1,902
Sq Ft
$268/Sq Ft
Est. Value
About This Home
This home is located at 9820 Washam Potts Rd, Cornelius, NC 28031 and is currently estimated at $510,487, approximately $268 per square foot. 9820 Washam Potts Rd is a home located in Mecklenburg County with nearby schools including J.V. Washam Elementary School, Bailey Middle School, and William Amos Hough High School.
Ownership History
Date
Name
Owned For
Owner Type
Purchase Details
Closed on
Aug 7, 2015
Sold by
Investors Resource Management Llc
Bought by
Mcdonald Ian W and Mcdonald Nichele A
Current Estimated Value
Home Financials for this Owner
Home Financials are based on the most recent Mortgage that was taken out on this home.
Original Mortgage
$255,290
Outstanding Balance
$201,193
Interest Rate
4.09%
Mortgage Type
FHA
Estimated Equity
$309,294
Purchase Details
Closed on
Feb 10, 2014
Sold by
Secretary Of Hud Of Washington Dc
Bought by
Investors Resource Management Llc
Home Financials for this Owner
Home Financials are based on the most recent Mortgage that was taken out on this home.
Original Mortgage
$132,000
Interest Rate
4.56%
Mortgage Type
New Conventional
Purchase Details
Closed on
Jun 4, 2013
Sold by
Hill Brenda B and Clay Brenda B
Bought by
The Secretary Of Hud Of Washington Dc
Purchase Details
Closed on
Aug 18, 1992
Bought by
Hill Brenda B
Create a Home Valuation Report for This Property
The Home Valuation Report is an in-depth analysis detailing your home's value as well as a comparison with similar homes in the area
Home Values in the Area
Average Home Value in this Area
Purchase History
| Date | Buyer | Sale Price | Title Company |
|---|---|---|---|
| Mcdonald Ian W | $260,000 | Attorney | |
| Investors Resource Management Llc | -- | None Available | |
| The Secretary Of Hud Of Washington Dc | $134,928 | None Available | |
| Hill Brenda B | $74,000 | -- |
Source: Public Records
Mortgage History
| Date | Status | Borrower | Loan Amount |
|---|---|---|---|
| Open | Mcdonald Ian W | $255,290 | |
| Previous Owner | Investors Resource Management Llc | $132,000 |
Source: Public Records
Tax History Compared to Growth
Tax History
| Year | Tax Paid | Tax Assessment Tax Assessment Total Assessment is a certain percentage of the fair market value that is determined by local assessors to be the total taxable value of land and additions on the property. | Land | Improvement |
|---|---|---|---|---|
| 2025 | $2,901 | $434,600 | $200,200 | $234,400 |
| 2024 | $2,901 | $434,600 | $200,200 | $234,400 |
| 2023 | $2,853 | $434,600 | $200,200 | $234,400 |
| 2022 | $2,068 | $238,900 | $87,100 | $151,800 |
| 2021 | $2,044 | $238,900 | $87,100 | $151,800 |
| 2020 | $2,044 | $238,900 | $87,100 | $151,800 |
| 2019 | $2,038 | $238,900 | $87,100 | $151,800 |
| 2018 | $1,707 | $155,800 | $41,400 | $114,400 |
| 2017 | $1,692 | $155,800 | $41,400 | $114,400 |
| 2016 | $1,689 | $155,800 | $41,400 | $114,400 |
| 2015 | $1,662 | $127,600 | $41,400 | $86,200 |
| 2014 | $1,362 | $0 | $0 | $0 |
Source: Public Records
Map
Nearby Homes
- 18200 Statesville Rd
- 9522 Cadman Ct
- 18605 Ruffner Dr Unit 3E
- 10125 Meadow Crossing Ln
- 10125 Westmoreland Rd
- 10104 Treetop Ln
- 10432 Audubon Ridge Dr
- 10416 Audubon Ridge Dr Unit 4
- 2224 Lantern Way Cir
- 10304 Squires Way
- 18810 Coachmans Trace
- 9204 Washam Potts Rd
- 11613 Truan Ln
- 10974 Heritage Green Dr
- 20209 Floral Ln
- 17151 Doe Valley Ct Unit 17151
- 20125 Floral Ln
- 17119 Doe Valley Ct Unit 17119
- 19839 Deer Valley Dr Unit 19839
- 10415 Danesway Ln
- 9902 Washam Potts Rd
- 9808 Washam Potts Rd
- 9817 Washam Potts Rd
- 6106 Addie Hall Ln
- 9823 Washam Potts Rd
- 6102 Addie Hall Ln
- 9724 Washam Potts Rd
- 7014 Washam Park Dr
- 7006 Washam Park Dr
- 7010 Washam Park Dr
- 9811 Washam Potts Rd
- 9831 Washam Potts Rd
- 6008 Addie Hall Ln
- 000 Washam Potts Rd
- 5008 Washam Green Ln
- 6004 Addie Hall Ln
- 7011 Washam Park Dr
- 7019 Washam Park Dr
- 5012 Washam Green Ln
- 7007 Washam Park Dr