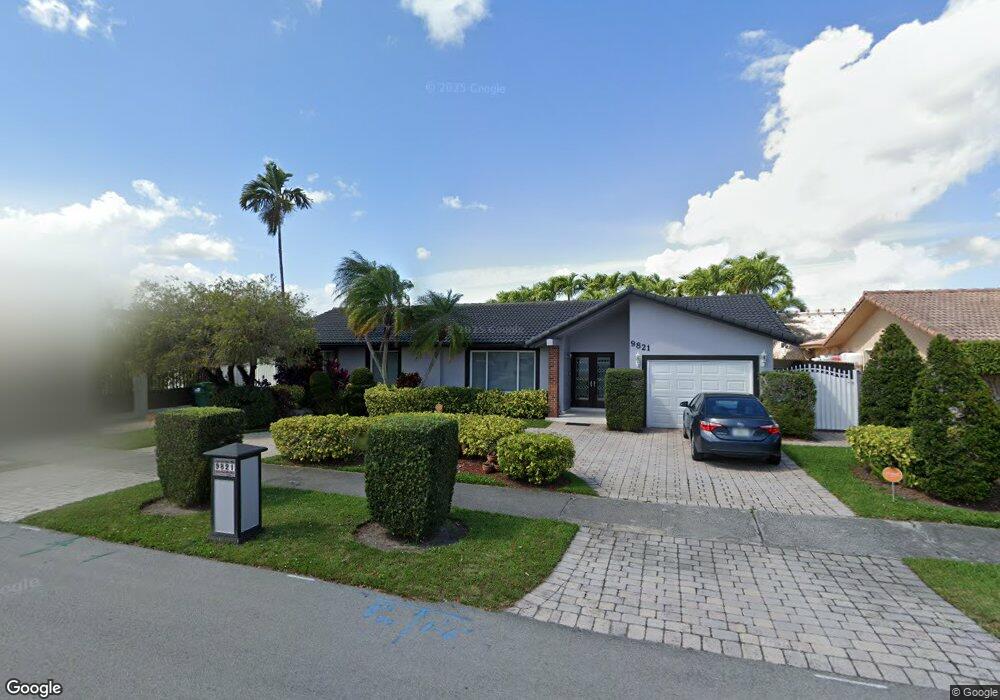
9821 SW 3rd St Miami, FL 33174
Fontainebleau Park West NeighborhoodEstimated Value: $711,074 - $777,000
4
Beds
2
Baths
2,343
Sq Ft
$316/Sq Ft
Est. Value
About This Home
This home is located at 9821 SW 3rd St, Miami, FL 33174 and is currently estimated at $739,519, approximately $315 per square foot. 9821 SW 3rd St is a home located in Miami-Dade County with nearby schools including E.W.F. Stirrup Elementary School, Ruben Dario Middle School, and Miami Coral Park Senior High School.
Ownership History
Date
Name
Owned For
Owner Type
Purchase Details
Closed on
Jun 5, 2009
Sold by
Sol Maria E Del
Bought by
Perez Jesus R
Current Estimated Value
Purchase Details
Closed on
May 30, 2007
Sold by
Garcia Milton
Bought by
Delsol Maria E
Purchase Details
Closed on
Jul 20, 2005
Sold by
Chavez Jose A
Bought by
Garcia Milton
Home Financials for this Owner
Home Financials are based on the most recent Mortgage that was taken out on this home.
Original Mortgage
$340,800
Interest Rate
5.79%
Mortgage Type
Unknown
Purchase Details
Closed on
Oct 15, 1997
Sold by
Hector and Sanchez Elsa
Bought by
Chavez Jose A and Chavez Adriana O
Home Financials for this Owner
Home Financials are based on the most recent Mortgage that was taken out on this home.
Original Mortgage
$127,500
Interest Rate
7.55%
Mortgage Type
New Conventional
Create a Home Valuation Report for This Property
The Home Valuation Report is an in-depth analysis detailing your home's value as well as a comparison with similar homes in the area
Home Values in the Area
Average Home Value in this Area
Purchase History
| Date | Buyer | Sale Price | Title Company |
|---|---|---|---|
| Perez Jesus R | $231,000 | -- | |
| Delsol Maria E | $424,000 | None Available | |
| Garcia Milton | $429,900 | Title Services Assoc Inc | |
| Chavez Jose A | $170,000 | -- |
Source: Public Records
Mortgage History
| Date | Status | Borrower | Loan Amount |
|---|---|---|---|
| Previous Owner | Garcia Milton | $340,800 | |
| Previous Owner | Chavez Jose A | $127,500 |
Source: Public Records
Tax History
| Year | Tax Paid | Tax Assessment Tax Assessment Total Assessment is a certain percentage of the fair market value that is determined by local assessors to be the total taxable value of land and additions on the property. | Land | Improvement |
|---|---|---|---|---|
| 2025 | $6,560 | $397,399 | -- | -- |
| 2024 | $6,256 | $386,200 | -- | -- |
| 2023 | $6,256 | $374,952 | $0 | $0 |
| 2022 | $6,026 | $364,032 | $0 | $0 |
| 2021 | $6,001 | $353,430 | $166,606 | $186,824 |
| 2020 | $6,046 | $354,903 | $166,606 | $188,297 |
| 2019 | $6,009 | $312,073 | $122,304 | $189,769 |
| 2018 | $5,862 | $313,545 | $122,304 | $191,241 |
| 2017 | $5,697 | $283,763 | $0 | $0 |
| 2016 | $5,314 | $257,967 | $0 | $0 |
| 2015 | $4,923 | $234,516 | $0 | $0 |
| 2014 | -- | $213,197 | $0 | $0 |
Source: Public Records
Map
Nearby Homes
- 602 SW 99th Place
- 9608 SW 2nd Ln Unit 1
- 733 SW 99th Court Cir S
- 106 SW 96th Ct Unit B
- 530 SW 101st Ct
- 10121 SW 4th St
- 9441 SW 4th St Unit 309
- 9466 SW 6th Ln
- 9420 W Flagler St Unit 207
- 9400 W Flagler St Unit 312
- 9401 SW 4th St Unit 3016
- 9440 W Flagler St Unit 201
- 9440 W Flagler St Unit 306
- 9411 SW 4th St Unit 404
- 9411 SW 4th St Unit 111
- 9411 SW 4th St Unit 202
- 9410 W Flagler St Unit 409
- 9520 SW 8th St Unit 123
- 9520 SW 8th St Unit 119
- 9620 SW 9th Terrace
- 9811 SW 3rd St
- 9831 SW 3rd St
- 9820 SW 2nd St Unit A
- 9822 SW 2nd St Unit B
- 9805 SW 2nd St Unit A
- 9820 SW 3rd St
- 9841 SW 3rd St
- 9801 SW 3rd St
- 9830 SW 3rd St
- 9810 SW 3rd St
- 9802 SW 2nd St Unit B
- 9800 SW 2nd St
- 9840 SW 3rd St
- 9800 SW 3rd St
- 9851 SW 3rd St
- 9741 SW 3rd St
- 9850 SW 2nd St Unit A
- 9742 SW 2nd St Unit B
- 9823 SW 2nd St Unit B
- 9811 SW 4th St
Your Personal Tour Guide
Ask me questions while you tour the home.