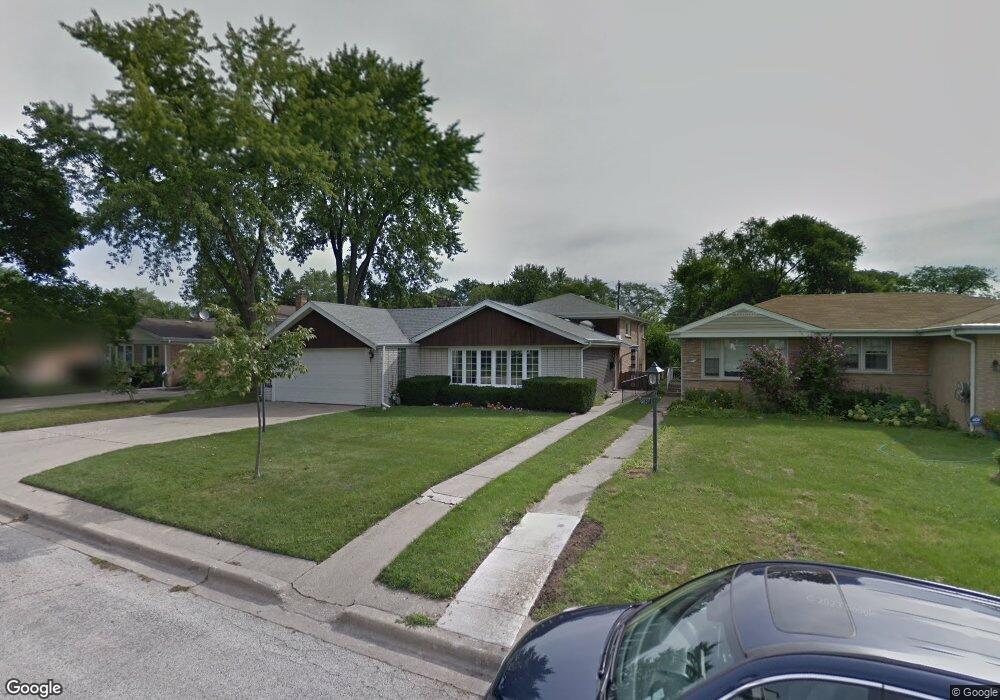
9825 Keystone Ave Skokie, IL 60076
North Skokie NeighborhoodEstimated Value: $511,000 - $573,000
4
Beds
2
Baths
1,482
Sq Ft
$369/Sq Ft
Est. Value
About This Home
This home is located at 9825 Keystone Ave, Skokie, IL 60076 and is currently estimated at $547,004, approximately $369 per square foot. 9825 Keystone Ave is a home located in Cook County with nearby schools including Old Orchard Jr High School, Highland Elementary School, and Niles North High School.
Ownership History
Date
Name
Owned For
Owner Type
Purchase Details
Closed on
Jun 15, 2004
Sold by
Hayden Paul A and Hayden Emily M
Bought by
Jacob Jobby and Jacob Sherry
Current Estimated Value
Home Financials for this Owner
Home Financials are based on the most recent Mortgage that was taken out on this home.
Original Mortgage
$336,000
Outstanding Balance
$129,222
Interest Rate
2.87%
Mortgage Type
Unknown
Estimated Equity
$417,782
Purchase Details
Closed on
Aug 8, 2001
Sold by
Golden Jerome and Golden Fern D
Bought by
Hayden Paul A and Hayden Emily M
Home Financials for this Owner
Home Financials are based on the most recent Mortgage that was taken out on this home.
Original Mortgage
$295,500
Interest Rate
7.23%
Create a Home Valuation Report for This Property
The Home Valuation Report is an in-depth analysis detailing your home's value as well as a comparison with similar homes in the area
Home Values in the Area
Average Home Value in this Area
Purchase History
| Date | Buyer | Sale Price | Title Company |
|---|---|---|---|
| Jacob Jobby | $420,000 | First American Title Ins Co | |
| Hayden Paul A | $352,000 | -- |
Source: Public Records
Mortgage History
| Date | Status | Borrower | Loan Amount |
|---|---|---|---|
| Open | Jacob Jobby | $336,000 | |
| Previous Owner | Hayden Paul A | $295,500 |
Source: Public Records
Tax History Compared to Growth
Tax History
| Year | Tax Paid | Tax Assessment Tax Assessment Total Assessment is a certain percentage of the fair market value that is determined by local assessors to be the total taxable value of land and additions on the property. | Land | Improvement |
|---|---|---|---|---|
| 2024 | $9,912 | $42,991 | $8,920 | $34,071 |
| 2023 | $9,622 | $42,991 | $8,920 | $34,071 |
| 2022 | $9,622 | $42,991 | $8,920 | $34,071 |
| 2021 | $7,946 | $32,364 | $6,132 | $26,232 |
| 2020 | $7,930 | $32,364 | $6,132 | $26,232 |
| 2019 | $7,917 | $35,565 | $6,132 | $29,433 |
| 2018 | $7,868 | $32,642 | $5,388 | $27,254 |
| 2017 | $7,942 | $32,642 | $5,388 | $27,254 |
| 2016 | $8,328 | $34,598 | $5,388 | $29,210 |
| 2015 | $7,662 | $30,073 | $4,645 | $25,428 |
| 2014 | $7,498 | $30,073 | $4,375 | $25,698 |
| 2013 | $7,465 | $30,073 | $4,375 | $25,698 |
Source: Public Records
Map
Nearby Homes
- 9833 Keystone Ave
- 2633 Crawford Ave
- 2518 Ridgeway Ave
- 3233 Central St
- 2719 Princeton Ave
- 2539 Marcy Ave
- 2951 Colfax St
- 9560 Drake Ave
- 9349 Lowell Ave
- 2131 Parkview Ct
- 9240 Avers Ave
- 9249 Kildare Ave
- 2113 Forestview Rd
- 9246 Kildare Ave
- 4354 Lyons St
- 146 Sterling Ln
- 2536 Old Glenview Rd
- 9457 Kenton Ave Unit F
- 9200 Hamlin Ave
- 9445 Kenton Ave Unit P30
- 9821 Keystone Ave
- 9821 Keystone Ave
- 9837 Keystone Ave
- 9828 Crawford Ave
- 9828 Crawford Ave
- 9824 Crawford Ave
- 9824 Crawford Ave
- 9832 Crawford Ave
- 9820 Crawford Ave
- 9820 Crawford Ave
- 9836 Crawford Ave
- 9845 Keystone Ave
- 9845 Keystone Ave
- 9824 Keystone Ave
- 9830 Keystone Ave
- 9830 Keystone Ave
- 9820 Keystone Ave
- 9820 Keystone Ave
- 9840 Crawford Ave
- 9834 Keystone Ave