Estimated Value: $712,755 - $964,000
5
Beds
3
Baths
3,748
Sq Ft
$227/Sq Ft
Est. Value
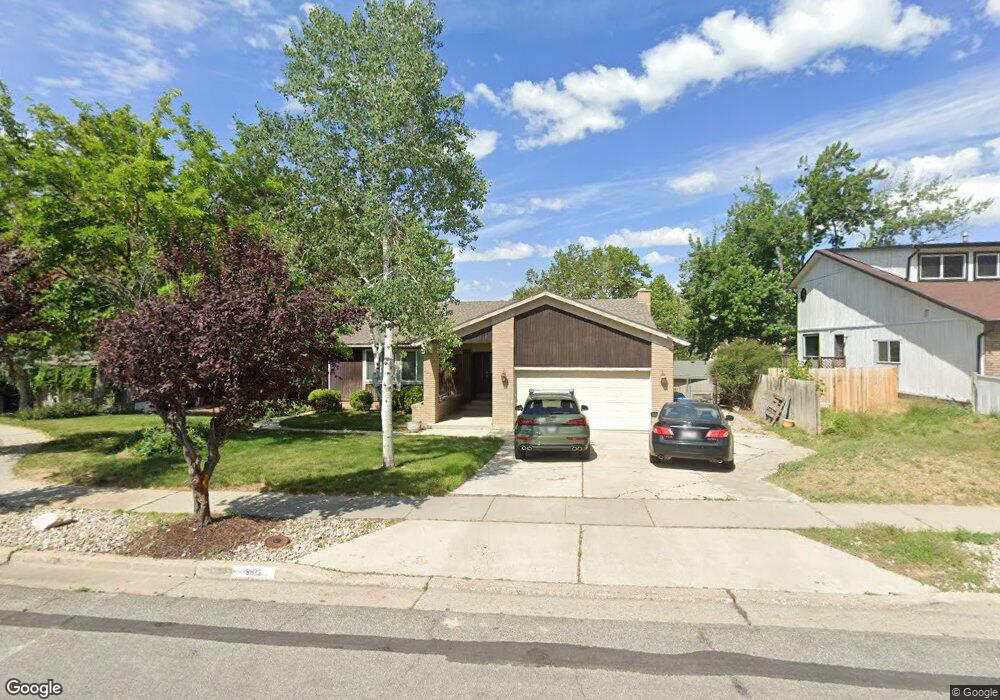
About This Home
This home is located at 9825 S 2465 E, Sandy, UT 84092 and is currently estimated at $850,439, approximately $226 per square foot. 9825 S 2465 E is a home located in Salt Lake County with nearby schools including Park Lane Elementary School, Eastmont Middle School, and Jordan High.
Ownership History
Date
Name
Owned For
Owner Type
Purchase Details
Closed on
May 13, 2020
Sold by
Miera Michael A
Bought by
Miera Michael A and Miera Dawn S
Current Estimated Value
Home Financials for this Owner
Home Financials are based on the most recent Mortgage that was taken out on this home.
Original Mortgage
$300,000
Outstanding Balance
$265,842
Interest Rate
3.3%
Mortgage Type
New Conventional
Estimated Equity
$584,597
Purchase Details
Closed on
Apr 22, 2015
Sold by
Weiss Jason M and Weiss Danielle R
Bought by
Miera Michael A
Home Financials for this Owner
Home Financials are based on the most recent Mortgage that was taken out on this home.
Original Mortgage
$310,083
Interest Rate
3.25%
Mortgage Type
FHA
Purchase Details
Closed on
Dec 2, 2005
Sold by
Allen Linda M
Bought by
Green Samantha
Home Financials for this Owner
Home Financials are based on the most recent Mortgage that was taken out on this home.
Original Mortgage
$56,600
Interest Rate
6.31%
Mortgage Type
Stand Alone Second
Purchase Details
Closed on
Aug 11, 2005
Sold by
Shaw Alan G
Bought by
Allen Linda M
Home Financials for this Owner
Home Financials are based on the most recent Mortgage that was taken out on this home.
Original Mortgage
$49,300
Interest Rate
5.48%
Mortgage Type
Stand Alone Second
Purchase Details
Closed on
Feb 4, 2003
Sold by
Shaw Susan K
Bought by
Shaw Alan G
Home Financials for this Owner
Home Financials are based on the most recent Mortgage that was taken out on this home.
Original Mortgage
$150,000
Interest Rate
5.24%
Purchase Details
Closed on
Dec 21, 1998
Sold by
Parry Colleen and Paull Howard D
Bought by
Shaw Alan G and Shaw Susan K
Home Financials for this Owner
Home Financials are based on the most recent Mortgage that was taken out on this home.
Original Mortgage
$156,000
Interest Rate
6.86%
Purchase Details
Closed on
Sep 30, 1997
Sold by
Snowbird Ltd
Bought by
Paull Howard D and Parry Colleen
Purchase Details
Closed on
Aug 29, 1996
Sold by
Parry Colleen
Bought by
Parry Colleen and Paull Howard D
Purchase Details
Closed on
Sep 15, 1994
Sold by
Gray Betty M
Bought by
Parry Colleen
Home Financials for this Owner
Home Financials are based on the most recent Mortgage that was taken out on this home.
Original Mortgage
$65,000
Interest Rate
8.58%
Purchase Details
Closed on
May 4, 1994
Sold by
Gray Betty M
Bought by
Gray Betty M and Parry Colleen
Create a Home Valuation Report for This Property
The Home Valuation Report is an in-depth analysis detailing your home's value as well as a comparison with similar homes in the area
Home Values in the Area
Average Home Value in this Area
Purchase History
| Date | Buyer | Sale Price | Title Company |
|---|---|---|---|
| Miera Michael A | -- | Us Title | |
| Miera Michael A | -- | Us Title | |
| Miera Michael A | -- | Meridian Title | |
| Green Samantha | -- | Inwest Title Services | |
| Allen Linda M | -- | Inwest Title Services | |
| Shaw Alan G | -- | Integrated Title Ins Service | |
| Shaw Alan G | -- | Landmark Title | |
| Paull Howard D | -- | -- | |
| Parry Colleen | -- | -- | |
| Parry Colleen | -- | -- | |
| Gray Betty M | -- | -- |
Source: Public Records
Mortgage History
| Date | Status | Borrower | Loan Amount |
|---|---|---|---|
| Open | Miera Michael A | $300,000 | |
| Closed | Miera Michael A | $310,083 | |
| Previous Owner | Green Samantha | $56,600 | |
| Previous Owner | Green Samantha | $226,400 | |
| Previous Owner | Allen Linda M | $49,300 | |
| Previous Owner | Allen Linda M | $197,200 | |
| Previous Owner | Shaw Alan G | $150,000 | |
| Previous Owner | Shaw Alan G | $156,000 | |
| Previous Owner | Parry Colleen | $65,000 |
Source: Public Records
Tax History
| Year | Tax Paid | Tax Assessment Tax Assessment Total Assessment is a certain percentage of the fair market value that is determined by local assessors to be the total taxable value of land and additions on the property. | Land | Improvement |
|---|---|---|---|---|
| 2025 | $3,542 | $686,100 | $249,700 | $436,400 |
| 2024 | $3,542 | $664,000 | $240,300 | $423,700 |
| 2023 | $3,179 | $594,800 | $231,100 | $363,700 |
| 2022 | $3,376 | $621,400 | $226,600 | $394,800 |
| 2021 | $2,990 | $468,500 | $173,900 | $294,600 |
| 2020 | $2,833 | $419,000 | $173,900 | $245,100 |
| 2019 | $2,910 | $419,800 | $164,000 | $255,800 |
| 2016 | $2,100 | $293,000 | $147,800 | $145,200 |
Source: Public Records
Map
Nearby Homes
- 9969 Altamont Dr
- 9942 S Altamont Dr
- 2724 Mount Jordan Rd
- 2170 E Borg Ct
- 2163 E Borg Dr
- 9650 S Buttonwood Dr
- 9472 Fox Hunt Dr
- 9457 S Fox Hunt Dr Unit 49
- 9637 S Tannenbaum Cove
- 9623 Tannenbaum Cove
- 9525 S Carriage Chase Ln
- 2329 E Woodchuck Cir
- 1952 E Bluffside Cir
- 10241 Dimple Dell Ln
- 10175 S Dimple Dell Rd
- 2009 E Sweetbriar Ln
- 2691 E Partridge Cove
- 2543 Cliff Swallow Dr
- 2333 Cliff Swallow Dr
- 9162 S Glenn Abbey Way
- 9809 S 2465 E
- 9837 S 2465 E
- 9834 S 2465 E
- 9828 Altamont Dr
- 9828 S Altamont Dr
- 9814 Altamont Dr
- 9824 S 2465 E
- 9954 Altamont Dr
- 9954 Altamont Dr Unit 3
- 9954 Altamont Dr Unit 6
- 9810 S 2465 E
- 9845 S 2465 E
- 9838 Altamont Dr
- 9844 S 2465 E
- 2477 E 9800 S
- 2469 E 9800 S
- 9811 S Cameron Place
- 2487 E 9800 S
- 9811 Cameron Place
- 2461 E 9800 S
Your Personal Tour Guide
Ask me questions while you tour the home.