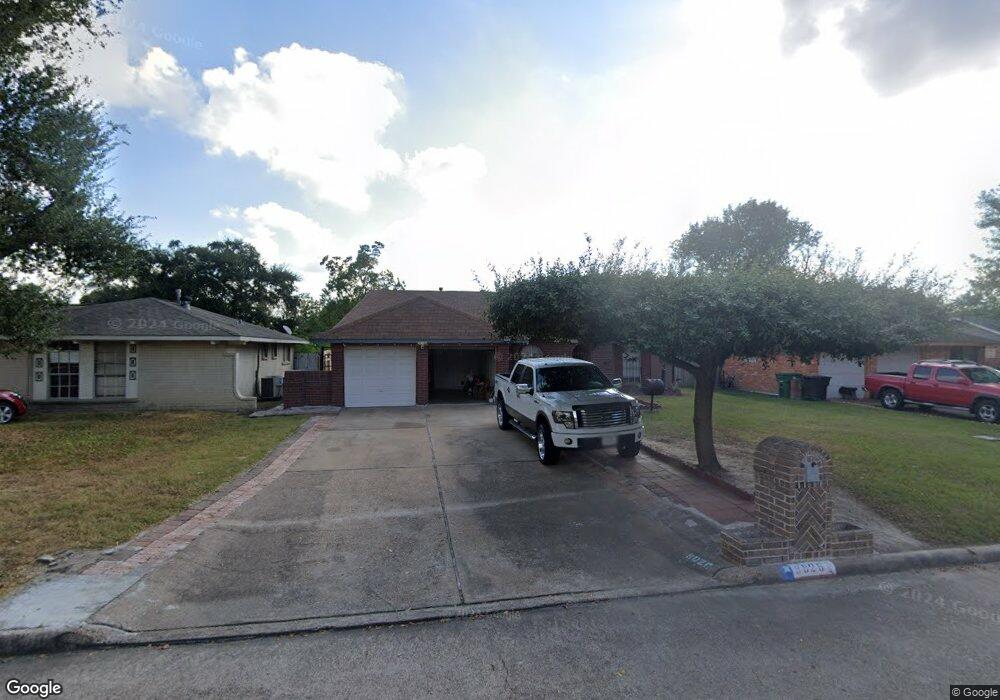
9826 Eblen Dr Houston, TX 77040
Greater Inwood NeighborhoodEstimated Value: $165,000 - $208,000
3
Beds
2
Baths
1,005
Sq Ft
$189/Sq Ft
Est. Value
About This Home
This home is located at 9826 Eblen Dr, Houston, TX 77040 and is currently estimated at $189,727, approximately $188 per square foot. 9826 Eblen Dr is a home located in Harris County with nearby schools including Edward a Vines EC/Pre-K/K School, Ermel Elementary School, and Dr. Viola K. Garcia Middle School.
Ownership History
Date
Name
Owned For
Owner Type
Purchase Details
Closed on
Jun 25, 2008
Sold by
Lopez Mario and Perez Martha
Bought by
Lopez Enrique
Current Estimated Value
Home Financials for this Owner
Home Financials are based on the most recent Mortgage that was taken out on this home.
Original Mortgage
$87,290
Outstanding Balance
$55,842
Interest Rate
5.99%
Mortgage Type
FHA
Estimated Equity
$133,885
Purchase Details
Closed on
Apr 4, 2006
Sold by
Clark Jonathan Nathaniel and Clark Marci A
Bought by
Lopez Mario and Lopez Enrique
Home Financials for this Owner
Home Financials are based on the most recent Mortgage that was taken out on this home.
Original Mortgage
$65,600
Interest Rate
8.91%
Mortgage Type
Fannie Mae Freddie Mac
Purchase Details
Closed on
Feb 26, 2001
Sold by
Erin Carbon Resources Inc
Bought by
Clark Jonathan Nathaniel
Home Financials for this Owner
Home Financials are based on the most recent Mortgage that was taken out on this home.
Original Mortgage
$66,198
Interest Rate
6.97%
Mortgage Type
VA
Create a Home Valuation Report for This Property
The Home Valuation Report is an in-depth analysis detailing your home's value as well as a comparison with similar homes in the area
Home Values in the Area
Average Home Value in this Area
Purchase History
| Date | Buyer | Sale Price | Title Company |
|---|---|---|---|
| Lopez Enrique | -- | Texas American Title Company | |
| Lopez Mario | -- | Stewart Title Houston Div | |
| Clark Jonathan Nathaniel | -- | Chicago Title Insurance Co |
Source: Public Records
Mortgage History
| Date | Status | Borrower | Loan Amount |
|---|---|---|---|
| Open | Lopez Enrique | $87,290 | |
| Previous Owner | Lopez Mario | $65,600 | |
| Previous Owner | Clark Jonathan Nathaniel | $66,198 |
Source: Public Records
Tax History Compared to Growth
Tax History
| Year | Tax Paid | Tax Assessment Tax Assessment Total Assessment is a certain percentage of the fair market value that is determined by local assessors to be the total taxable value of land and additions on the property. | Land | Improvement |
|---|---|---|---|---|
| 2025 | $43 | $188,357 | $41,580 | $146,777 |
| 2024 | $43 | $180,893 | $39,600 | $141,293 |
| 2023 | $43 | $179,386 | $39,600 | $139,786 |
| 2022 | $3,424 | $149,784 | $33,660 | $116,124 |
| 2021 | $3,259 | $129,758 | $33,660 | $96,098 |
| 2020 | $3,164 | $119,878 | $16,500 | $103,378 |
| 2019 | $3,066 | $110,817 | $16,500 | $94,317 |
| 2018 | $1,386 | $96,507 | $16,500 | $80,007 |
| 2017 | $2,560 | $96,507 | $16,500 | $80,007 |
| 2016 | $2,234 | $84,205 | $16,500 | $67,705 |
| 2015 | $1,607 | $79,256 | $16,500 | $62,756 |
| 2014 | $1,607 | $60,408 | $16,500 | $43,908 |
Source: Public Records
Map
Nearby Homes
- 7606 Battlepine Dr
- 7706 Deadwood Dr
- 7707 Lumber Jack Dr
- 9523 Vanwood St
- 7731 Deadwood Dr
- 7803 Yellow Pine Dr
- 7823 Lumber Jack Dr
- 7210 Lumber Jack Dr
- 7322 Sawmill Trail
- 7410 Log Hollow Dr
- 7727 Log Hollow Dr
- 9331 Deanwood St
- 9350 Guywood St
- 7051 Majestic Oaks Dr
- 7911 Battleoak Dr
- 7918 Battleoak Dr
- 10126 Pine Moss Dr
- 7718 Breezeway St
- 9207 Loren Ln
- 10143 Inwood Hollow Ln