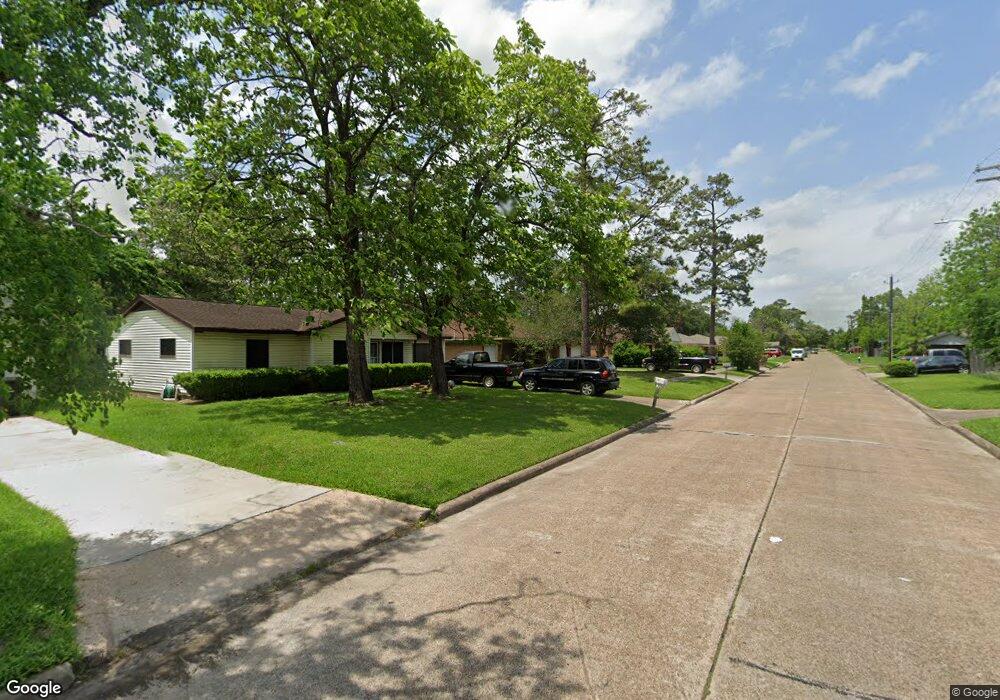
9827 Rebel Rd Houston, TX 77016
East Little York NeighborhoodEstimated Value: $187,000 - $241,000
3
Beds
2
Baths
2,092
Sq Ft
$99/Sq Ft
Est. Value
About This Home
This home is located at 9827 Rebel Rd, Houston, TX 77016 and is currently estimated at $206,663, approximately $98 per square foot. 9827 Rebel Rd is a home located in Harris County with nearby schools including Shadydale Elementary School, Forest Brook Middle, and North Forest High School.
Ownership History
Date
Name
Owned For
Owner Type
Purchase Details
Closed on
Jun 20, 2009
Sold by
Bhagia Sarojini
Bought by
Sahara Group Lp
Current Estimated Value
Purchase Details
Closed on
Oct 1, 2002
Sold by
Davis Angela
Bought by
Bhagia Sarogini
Purchase Details
Closed on
Sep 26, 1997
Sold by
Fagan Donald E and Fagan Donald E
Bought by
Thomas Tomlee and Thomas Angela
Purchase Details
Closed on
Jun 24, 1997
Sold by
Mccluskey John
Bought by
Davis Angela Chevalier
Purchase Details
Closed on
Jun 17, 1997
Sold by
Mccluskey John E
Bought by
Davis Angela Chevalier
Purchase Details
Closed on
Aug 17, 1995
Sold by
Chevalier Mary M
Bought by
Davis Angela
Purchase Details
Closed on
Jun 2, 1995
Sold by
Scott Patricia and Coley Mark
Bought by
Davis Angela
Purchase Details
Closed on
Apr 7, 1995
Sold by
King Arthur D and King Deborah A Young
Bought by
Davis Angela Chevalier
Create a Home Valuation Report for This Property
The Home Valuation Report is an in-depth analysis detailing your home's value as well as a comparison with similar homes in the area
Home Values in the Area
Average Home Value in this Area
Purchase History
| Date | Buyer | Sale Price | Title Company |
|---|---|---|---|
| Sahara Group Lp | -- | None Available | |
| Bhagia Sarogini | $44,100 | -- | |
| Thomas Tomlee | -- | Charter Title Company | |
| Davis Angela Chevalier | -- | -- | |
| Davis Angela Chevalier | -- | -- | |
| Davis Angela | -- | -- | |
| Davis Angela | -- | Houston Title Company 527 | |
| Davis Angela Chevalier | -- | -- |
Source: Public Records
Tax History Compared to Growth
Tax History
| Year | Tax Paid | Tax Assessment Tax Assessment Total Assessment is a certain percentage of the fair market value that is determined by local assessors to be the total taxable value of land and additions on the property. | Land | Improvement |
|---|---|---|---|---|
| 2025 | $3,932 | $187,925 | $45,615 | $142,310 |
| 2024 | $3,932 | $187,925 | $45,615 | $142,310 |
| 2023 | $4,701 | $266,391 | $45,615 | $220,776 |
| 2022 | $4,751 | $190,512 | $36,401 | $154,111 |
| 2021 | $4,126 | $177,025 | $24,267 | $152,758 |
| 2020 | $3,795 | $156,724 | $18,027 | $138,697 |
| 2019 | $3,661 | $144,694 | $12,896 | $131,798 |
| 2018 | $709 | $28,018 | $12,480 | $15,538 |
| 2017 | $2,081 | $82,507 | $12,480 | $70,027 |
| 2016 | $1,644 | $65,000 | $12,480 | $52,520 |
| 2015 | $1,666 | $42,000 | $12,480 | $29,520 |
| 2014 | $1,666 | $64,827 | $12,480 | $52,347 |
Source: Public Records
Map
Nearby Homes
- 7611 Cabot St
- 0 Wileyvale Rd Unit 37533417
- 0 Laura Koppe Rd Unit 64066450
- 0 Lockwood Unit 97801497
- 0 Wileyvale Rd Unit 98938709
- 7314 Sterlingshire St
- 7338 Bigwood St
- 0 Bretshire Dr Unit 83088734
- 0 Bretshire Dr Unit 61965426
- 7639 Bigwood St
- 7603 Caddo Rd
- 7242 Bretshire Dr
- 7717 Bigwood St
- 10101 Rebel Rd
- 10106 Cheeves Dr
- 7402 Yoe St
- 7218 Bretshire Dr
- 7305 Yoe St
- 10125 Rebel Rd
- 7306 Parker Rd
- 9823 Rebel Rd
- 9831 Rebel Rd
- 9819 Rebel Rd
- 9901 Rebel Rd
- 7602 Cabot St
- 9815 Rebel Rd
- 9830 Cheeves Dr
- 9905 Rebel Rd
- 9826 Cheeves Dr
- 9834 Cheeves Dr
- 9822 Cheeves Dr
- 7606 Cabot St
- 7607 Claiborne St
- 9902 Cheeves Dr
- 9811 Rebel Rd
- 9818 Cheeves Dr
- 9913 Rebel Rd
- 7603 Cabot St
- 9906 Cheeves Dr
- 7602 Claiborne St