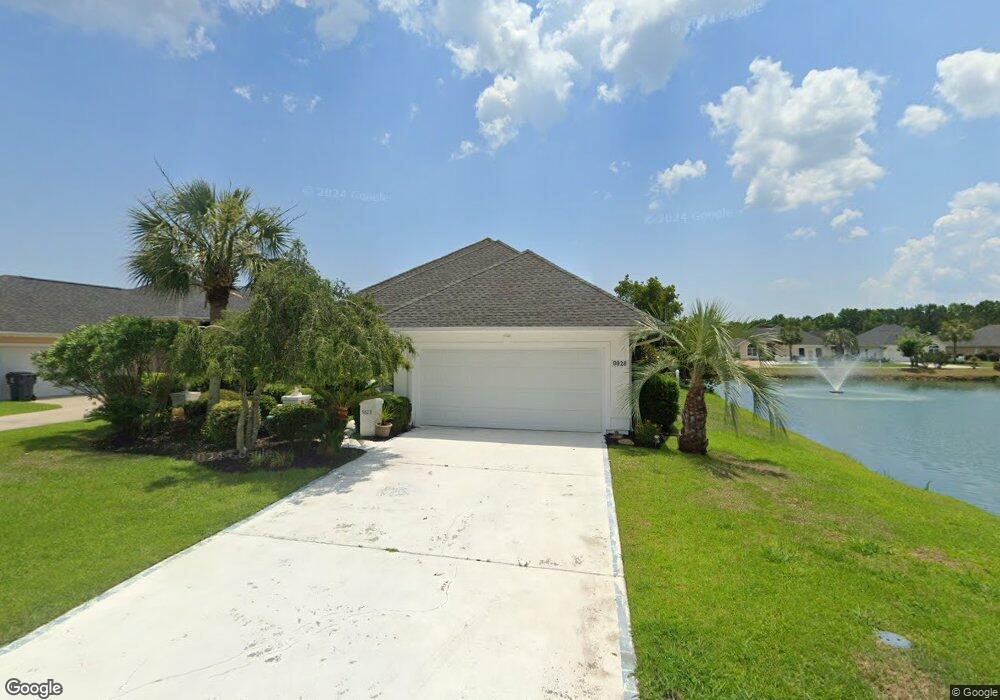
9828 Simonton Ct Murrells Inlet, SC 29576
Burgess NeighborhoodEstimated Value: $323,000 - $409,000
3
Beds
2
Baths
1,652
Sq Ft
$217/Sq Ft
Est. Value
About This Home
This home is located at 9828 Simonton Ct, Murrells Inlet, SC 29576 and is currently estimated at $358,075, approximately $216 per square foot. 9828 Simonton Ct is a home located in Horry County with nearby schools including St. James Elementary School, St. James Middle School, and St. James Intermediate.
Ownership History
Date
Name
Owned For
Owner Type
Purchase Details
Closed on
Oct 18, 2006
Sold by
Swilling Joshua and Swilling Molly
Bought by
Wallace Joy E
Current Estimated Value
Purchase Details
Closed on
Dec 27, 2005
Sold by
Swilling Molly and Swilling Joshua
Bought by
Swilling Joshua and Swilling Molly
Purchase Details
Closed on
Jul 15, 2004
Sold by
The Burrow Llc
Bought by
Flanagan Molly and Swilling Joshua
Home Financials for this Owner
Home Financials are based on the most recent Mortgage that was taken out on this home.
Original Mortgage
$158,500
Interest Rate
8.4%
Mortgage Type
Purchase Money Mortgage
Purchase Details
Closed on
Jul 30, 1999
Sold by
Carver Edward A and Carver Lynne A
Bought by
The Burrow Llc
Home Financials for this Owner
Home Financials are based on the most recent Mortgage that was taken out on this home.
Original Mortgage
$123,900
Interest Rate
7.13%
Mortgage Type
Purchase Money Mortgage
Purchase Details
Closed on
Jun 11, 1999
Sold by
Suntech Ad Llc
Bought by
Carver Edward A and Carver Lynne A
Home Financials for this Owner
Home Financials are based on the most recent Mortgage that was taken out on this home.
Original Mortgage
$123,900
Interest Rate
7.13%
Mortgage Type
Purchase Money Mortgage
Create a Home Valuation Report for This Property
The Home Valuation Report is an in-depth analysis detailing your home's value as well as a comparison with similar homes in the area
Home Values in the Area
Average Home Value in this Area
Purchase History
| Date | Buyer | Sale Price | Title Company |
|---|---|---|---|
| Wallace Joy E | $217,000 | None Available | |
| Swilling Joshua | -- | None Available | |
| Flanagan Molly | $158,500 | -- | |
| The Burrow Llc | $154,925 | -- | |
| Carver Edward A | $154,925 | -- |
Source: Public Records
Mortgage History
| Date | Status | Borrower | Loan Amount |
|---|---|---|---|
| Previous Owner | Flanagan Molly | $158,500 | |
| Previous Owner | Carver Edward A | $123,900 |
Source: Public Records
Tax History Compared to Growth
Tax History
| Year | Tax Paid | Tax Assessment Tax Assessment Total Assessment is a certain percentage of the fair market value that is determined by local assessors to be the total taxable value of land and additions on the property. | Land | Improvement |
|---|---|---|---|---|
| 2024 | -- | $14,296 | $4,600 | $9,696 |
| 2023 | $578 | $7,102 | $1,314 | $5,788 |
| 2021 | $527 | $7,102 | $1,314 | $5,788 |
| 2020 | $454 | $7,102 | $1,314 | $5,788 |
| 2019 | $454 | $7,102 | $1,314 | $5,788 |
| 2018 | $0 | $7,418 | $1,030 | $6,388 |
| 2017 | $0 | $7,418 | $1,030 | $6,388 |
| 2016 | $0 | $7,418 | $1,030 | $6,388 |
| 2015 | -- | $7,418 | $1,030 | $6,388 |
| 2014 | $404 | $7,418 | $1,030 | $6,388 |
Source: Public Records
Map
Nearby Homes
- 596 Canborough Ln
- 9902 Largo Ct
- 10939 Tournament Blvd
- 128 Cypress Estates Dr
- 901 Inlet Keys St
- 903 Inlet Keys St
- 905 Inlet Keys St
- Camden Plan at Inlet Keys
- 910 Inlet Keys St
- Georgetown Plan at Inlet Keys
- Savannah Plan at Inlet Keys
- 405 Heathside St
- 116 Glengrove Ln
- 11140 McDowell Shortcut Rd
- 11140 McDowell Short Cut Rd Unit 55
- 7939 Leeward Ln
- 609 Sailbrooke Ct Unit 105
- 115 Veranda Way Unit 6A
- 751 Painted Bunting Dr Unit E
- 751 Painted Bunting Dr Unit B
- 9830 Simonton Ct
- 9909 Largo Ct
- 9911 Largo Ct
- 9832 Simonton Ct
- 9913 Largo Ct
- 9820 Simonton Ct
- 9825 Simonton Ct
- 9915 Largo Ct
- 9834 Simonton Ct
- 9829 Simonton Ct
- 9823 Simonton Ct
- 9831 Simonton Ct
- 9818 Simonton Ct
- 9917 Largo Ct
- 9821 Simonton Ct
- 9836 Simonton Ct
- 9903 Largo Ct Unit Cypress Keyes
- 9903 Largo Ct
- 9833 Simonton Ct
- 9910 Largo Ct