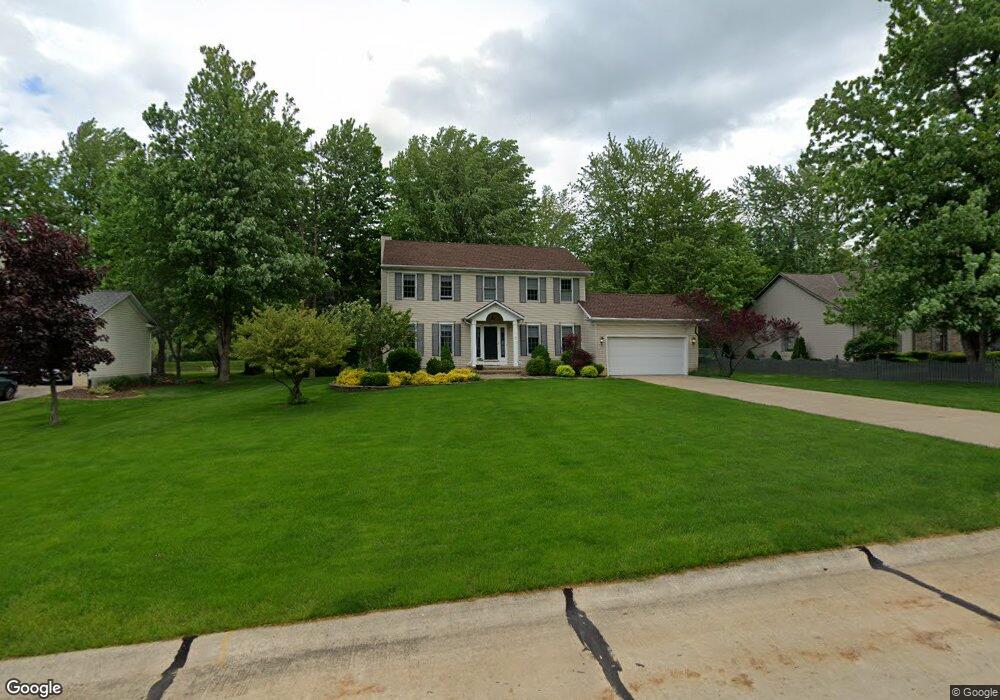
9829 Wellesly Blvd Painesville, OH 44077
Estimated Value: $301,000 - $420,000
4
Beds
3
Baths
1,160
Sq Ft
$309/Sq Ft
Est. Value
About This Home
This home is located at 9829 Wellesly Blvd, Painesville, OH 44077 and is currently estimated at $357,968, approximately $308 per square foot. 9829 Wellesly Blvd is a home located in Lake County with nearby schools including Hopkins Elementary School, Memorial Middle School, and Mentor High School.
Ownership History
Date
Name
Owned For
Owner Type
Purchase Details
Closed on
May 22, 2015
Sold by
Meadon James M and Meadon Jacqueline
Bought by
Meadon James M and Meadon Jacqueline
Current Estimated Value
Home Financials for this Owner
Home Financials are based on the most recent Mortgage that was taken out on this home.
Original Mortgage
$112,000
Outstanding Balance
$87,515
Interest Rate
4.08%
Mortgage Type
New Conventional
Estimated Equity
$270,453
Purchase Details
Closed on
May 26, 2006
Sold by
Blattner Randall L and Blattner Nancy J
Bought by
Meadon James M and Slavick Jacqueline
Home Financials for this Owner
Home Financials are based on the most recent Mortgage that was taken out on this home.
Original Mortgage
$132,000
Interest Rate
6.56%
Mortgage Type
Fannie Mae Freddie Mac
Purchase Details
Closed on
Jul 5, 1996
Sold by
Cadorette Denis G
Bought by
Blattner Randall L and Blattner Nancy
Create a Home Valuation Report for This Property
The Home Valuation Report is an in-depth analysis detailing your home's value as well as a comparison with similar homes in the area
Home Values in the Area
Average Home Value in this Area
Purchase History
| Date | Buyer | Sale Price | Title Company |
|---|---|---|---|
| Meadon James M | -- | None Available | |
| Meadon James M | $242,000 | Enterprise Title | |
| Blattner Randall L | $191,000 | -- |
Source: Public Records
Mortgage History
| Date | Status | Borrower | Loan Amount |
|---|---|---|---|
| Open | Meadon James M | $112,000 | |
| Closed | Meadon James M | $132,000 | |
| Closed | Blattner Randall L | -- |
Source: Public Records
Tax History Compared to Growth
Tax History
| Year | Tax Paid | Tax Assessment Tax Assessment Total Assessment is a certain percentage of the fair market value that is determined by local assessors to be the total taxable value of land and additions on the property. | Land | Improvement |
|---|---|---|---|---|
| 2024 | -- | $96,610 | $29,990 | $66,620 |
| 2023 | $10,095 | $90,420 | $23,960 | $66,460 |
| 2022 | $4,265 | $90,420 | $23,960 | $66,460 |
| 2021 | $4,279 | $90,420 | $23,960 | $66,460 |
| 2020 | $4,177 | $78,630 | $20,840 | $57,790 |
| 2019 | $4,140 | $78,630 | $20,840 | $57,790 |
| 2018 | $3,893 | $66,590 | $20,050 | $46,540 |
| 2017 | $3,656 | $66,590 | $20,050 | $46,540 |
| 2016 | $3,621 | $66,590 | $20,050 | $46,540 |
| 2015 | $3,299 | $66,590 | $20,050 | $46,540 |
| 2014 | $3,279 | $66,590 | $20,050 | $46,540 |
| 2013 | $3,282 | $66,590 | $20,050 | $46,540 |
Source: Public Records
Map
Nearby Homes
- 2155 Ridgebury Dr
- 6931 Chairmans Ct
- 9820 Old Johnnycake Ridge Rd Unit 5
- 9846 Old Johnnycake Ridge Rd
- 41 Warrington Ln
- 317 Chesapeake Cove Unit 317
- 9681 Abbeyshire Way
- 110 Hampshire Cove Unit 110
- 2051 Kingsborough Dr
- 135 Nantucket Cir
- 8 Johnnycake Ridge Rd
- 7065 Brightwood Dr
- 7057 Brightwood Dr
- 7069 Brightwood Dr
- 9828 Gabriel's Way
- 7152 Rippling Brook Ln Unit L6
- 1936 Mentor Ave
- 9740 Gamekeeper Ct Unit U3
- 81 Fairfield Rd
- 339 Barrington Ridge Rd
- 9823 Wellesly Blvd
- 9835 Wellesly Blvd
- 9815 Wellesly Blvd
- 9811 Wellesly Blvd
- 9812 Wellesley Blvd
- 9812 Wellesly Blvd
- 9806 Wellesly Blvd
- 9798 Wellesly Blvd
- 9805 Wellesly Blvd
- 365 Chesapeake Cove Unit 365
- 367 Chesapeake Cove
- 363 Chesapeake Cove
- 361 Chesapeake Cove
- 9830 Wellesly Blvd
- 9836 Wellesly Blvd
- 9790 Wellesly Blvd
- 2161 Ridgebury Dr
- 477 Scarborough Ln
- 369 Chesapeake Cove
- 9795 Wellesley Blvd