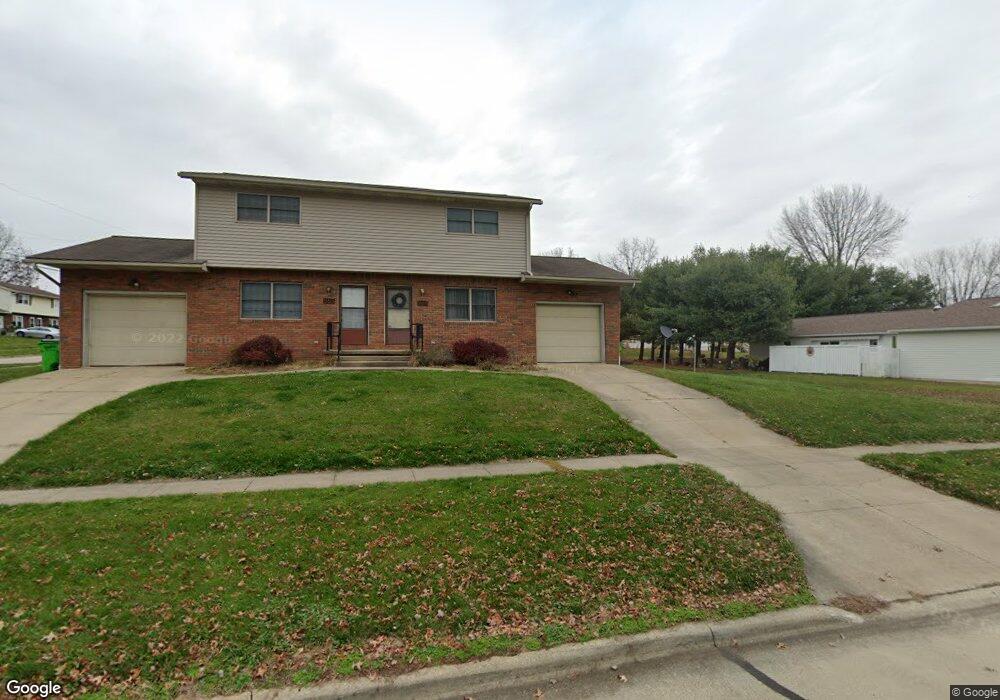
983 Carriage Ln Wooster, OH 44691
Estimated Value: $215,000 - $276,329
6
Beds
4
Baths
1,944
Sq Ft
$121/Sq Ft
Est. Value
About This Home
This home is located at 983 Carriage Ln, Wooster, OH 44691 and is currently estimated at $234,832, approximately $120 per square foot. 983 Carriage Ln is a home located in Wayne County with nearby schools including Parkview Elementary School, Edgewood Middle School, and Wooster High School.
Ownership History
Date
Name
Owned For
Owner Type
Purchase Details
Closed on
Sep 27, 2021
Sold by
Panoca Ltd
Bought by
Discover Time Holdings Llc
Current Estimated Value
Home Financials for this Owner
Home Financials are based on the most recent Mortgage that was taken out on this home.
Original Mortgage
$100,000
Outstanding Balance
$84,555
Interest Rate
2.8%
Mortgage Type
Commercial
Estimated Equity
$150,277
Purchase Details
Closed on
Dec 23, 2019
Sold by
Trigem Ltd
Bought by
Discover Time Holdings Llc
Purchase Details
Closed on
Sep 18, 1992
Sold by
Beechy Marie G
Bought by
Gem Enterprises
Purchase Details
Closed on
Jan 29, 1992
Sold by
Beechy Orin B and Beechy Marie G
Bought by
Beechy Marie G
Purchase Details
Closed on
Mar 7, 1991
Sold by
Beechy Orin B
Bought by
Beechy Orin B and Beechy Marie G
Create a Home Valuation Report for This Property
The Home Valuation Report is an in-depth analysis detailing your home's value as well as a comparison with similar homes in the area
Home Values in the Area
Average Home Value in this Area
Purchase History
| Date | Buyer | Sale Price | Title Company |
|---|---|---|---|
| Discover Time Holdings Llc | $106,670 | None Available | |
| Discover Time Holdings Llc | $106,700 | Stutzman Morris | |
| Discover Time Holdings Llc | -- | None Available | |
| Gem Enterprises | $15,000 | -- | |
| Beechy Marie G | -- | -- | |
| Beechy Orin B | -- | -- |
Source: Public Records
Mortgage History
| Date | Status | Borrower | Loan Amount |
|---|---|---|---|
| Open | Discover Time Holdings Llc | $100,000 | |
| Closed | Discover Time Holdings Llc | $100,000 |
Source: Public Records
Tax History Compared to Growth
Tax History
| Year | Tax Paid | Tax Assessment Tax Assessment Total Assessment is a certain percentage of the fair market value that is determined by local assessors to be the total taxable value of land and additions on the property. | Land | Improvement |
|---|---|---|---|---|
| 2024 | $3,132 | $73,760 | $16,140 | $57,620 |
| 2023 | $3,132 | $73,760 | $16,140 | $57,620 |
| 2022 | $2,872 | $53,840 | $11,780 | $42,060 |
| 2021 | $2,961 | $53,840 | $11,780 | $42,060 |
| 2020 | $2,811 | $53,840 | $11,780 | $42,060 |
| 2019 | $2,512 | $46,130 | $10,400 | $35,730 |
| 2018 | $2,519 | $46,130 | $10,400 | $35,730 |
| 2017 | $2,506 | $46,130 | $10,400 | $35,730 |
| 2016 | $2,625 | $44,430 | $10,400 | $34,030 |
| 2015 | $2,578 | $44,430 | $10,400 | $34,030 |
| 2014 | $2,580 | $44,430 | $10,400 | $34,030 |
| 2013 | $2,732 | $46,550 | $10,420 | $36,130 |
Source: Public Records
Map
Nearby Homes
- 1951 Saddle Brook Cir Unit 1951
- 1694 Arthur Dr
- 1960 Autumn Run
- 941 Woodmere Dr
- 629 Meadow Ln
- 2194 Ryan Ct
- 596 Meadow Ln
- 1100 Nelson Ave
- 1680 Carlin Trail
- 1633 Carlin Trail
- 2117 Canterbury Ln
- 1587 Saunders Dr
- Tupelo Plan at Clear Creek Run
- Hazel Plan at Clear Creek Run
- Aspen Plan at Clear Creek Run
- Spruce Plan at Clear Creek Run
- Cedar Plan at Clear Creek Run
- 2143 Canterbury Ln
- 2360 Star Dr
- 577 Memory Ln
- 984 Carriage Ln
- 1785 Normandy Dr
- 963 Carriage Ln
- 960 Carriage Ln
- 1772 Normandy Dr
- 1772 Normandy Dr
- 1772 Normandy Dr
- 1772 Normandy Dr
- 1772 Normandy Dr Unit 204
- 1772 Normandy Dr
- 1772 Normandy Dr
- 1772 Normandy Dr Unit 201-202-203-206-207
- 951 Carriage Ln
- 1791 Normandy Dr
- 940 Pepperwood Dr
- 1784 Normandy Dr
- 1784 Normandy Dr
- 1784 Normandy Dr
- 1784 Normandy Dr
- 1784 Normandy Dr