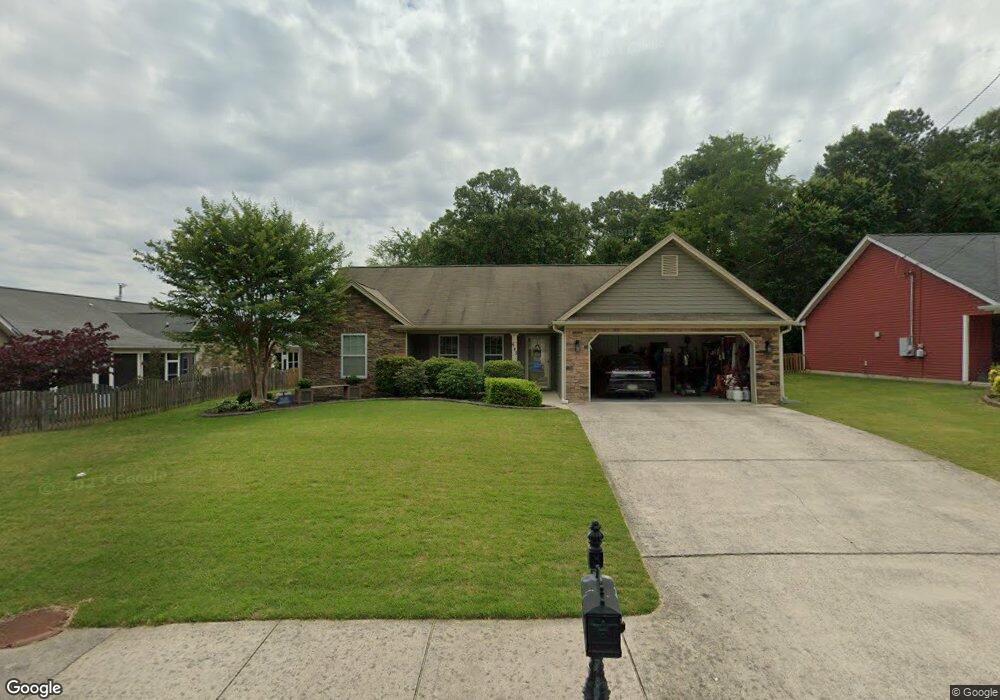
983 Colony Cir Fort Oglethorpe, GA 30742
Estimated Value: $277,460 - $311,000
--
Bed
2
Baths
1,343
Sq Ft
$218/Sq Ft
Est. Value
About This Home
This home is located at 983 Colony Cir, Fort Oglethorpe, GA 30742 and is currently estimated at $292,365, approximately $217 per square foot. 983 Colony Cir is a home located in Catoosa County with nearby schools including West Side Elementary School, Lakeview Middle School, and Lakeview-Fort Oglethorpe High School.
Ownership History
Date
Name
Owned For
Owner Type
Purchase Details
Closed on
May 28, 2015
Sold by
Giddens Brenda C
Bought by
Richards Gary D
Current Estimated Value
Home Financials for this Owner
Home Financials are based on the most recent Mortgage that was taken out on this home.
Original Mortgage
$123,500
Outstanding Balance
$95,790
Interest Rate
3.79%
Mortgage Type
New Conventional
Estimated Equity
$196,575
Purchase Details
Closed on
Mar 28, 2008
Sold by
Earth Craft Builders Llc
Bought by
Giddens Brdnda C
Home Financials for this Owner
Home Financials are based on the most recent Mortgage that was taken out on this home.
Original Mortgage
$132,421
Interest Rate
6.22%
Mortgage Type
FHA
Purchase Details
Closed on
Aug 13, 2007
Sold by
Not Provided
Bought by
Giddens Brenda C
Purchase Details
Closed on
Oct 20, 2005
Sold by
Not Provided
Bought by
Giddens Brenda C
Create a Home Valuation Report for This Property
The Home Valuation Report is an in-depth analysis detailing your home's value as well as a comparison with similar homes in the area
Home Values in the Area
Average Home Value in this Area
Purchase History
| Date | Buyer | Sale Price | Title Company |
|---|---|---|---|
| Richards Gary D | $130,000 | -- | |
| Giddens Brdnda C | $134,500 | -- | |
| Giddens Brenda C | $32,000 | -- | |
| Giddens Brenda C | -- | -- |
Source: Public Records
Mortgage History
| Date | Status | Borrower | Loan Amount |
|---|---|---|---|
| Open | Richards Gary D | $123,500 | |
| Previous Owner | Giddens Brdnda C | $132,421 |
Source: Public Records
Tax History Compared to Growth
Tax History
| Year | Tax Paid | Tax Assessment Tax Assessment Total Assessment is a certain percentage of the fair market value that is determined by local assessors to be the total taxable value of land and additions on the property. | Land | Improvement |
|---|---|---|---|---|
| 2024 | $2,835 | $107,767 | $11,000 | $96,767 |
| 2023 | $2,348 | $83,595 | $11,000 | $72,595 |
| 2022 | $1,838 | $65,436 | $11,000 | $54,436 |
| 2021 | $1,742 | $65,436 | $11,000 | $54,436 |
| 2020 | $1,726 | $58,462 | $11,000 | $47,462 |
| 2019 | $1,714 | $57,462 | $10,000 | $47,462 |
| 2018 | $1,801 | $57,462 | $10,000 | $47,462 |
| 2017 | $1,758 | $56,094 | $10,000 | $46,094 |
| 2016 | $1,702 | $52,650 | $10,000 | $42,650 |
| 2015 | -- | $52,650 | $10,000 | $42,650 |
| 2014 | -- | $52,650 | $10,000 | $42,650 |
| 2013 | -- | $50,543 | $9,600 | $40,943 |
Source: Public Records
Map
Nearby Homes
- 17 Southshore Dr
- 351 Franklin Cir
- 124 Colony Cir
- 129 Cedar Grove Ln
- 17 Evergreen Cir
- 2237 Cloud Springs Rd
- 6 Rocky Ford Rd
- 18 Evergreen Cir
- 14 Evergreen Cir
- 180 Gem Dr
- 183 McDonald Dr
- 300 Dogwood Ln
- 301 Dogwood Ln
- 325 Mockingbird Ln
- 1305 Park Forrest Dr
- 1002 Cedar Creek Dr
- Robie Plan at Evergreen Landing
- Darwin Plan at Evergreen Landing
- Edmon Plan at Evergreen Landing
- Sullivan Plan at Evergreen Landing
- 997 Colony Cir
- 18 Tradewind Dr
- 18 Tradewind Dr Unit LT 155
- 16 Tradewind Dr
- 16 Tradewind Dr Unit LT 155
- 20 Tradewind Dr Unit 3
- 20 Tradewind Dr
- 20 Tradewind Dr Unit LT 155
- 20 Trade Wind Dr
- 22 Tradewind Dr
- 22 Tradewind Dr Unit LT 155
- 1011 Colony Cir
- 44 Tradewind Dr
- 44 Tradewind Dr Unit LT 156A
- 0 Tradewind Dr
- 0 Tradewind Dr Unit 1146202
- 982 Colony Cir
- 962 Colony Cir
- 962 Colony Cir Unit LT 128A
- 996 Colony Cir