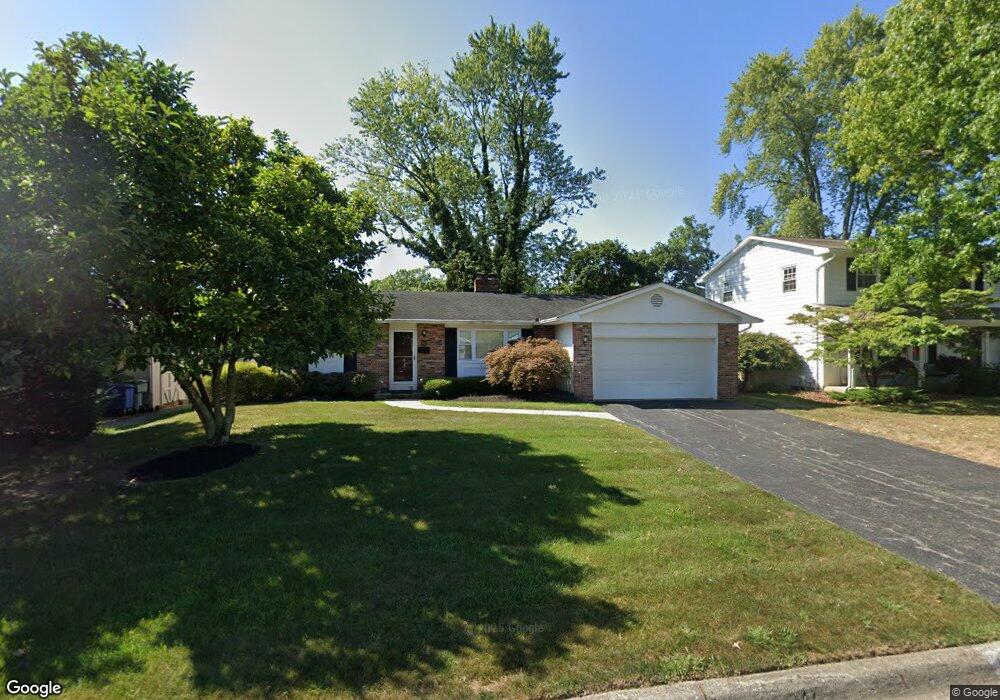
983 Lansmere Ln Columbus, OH 43220
Brentwood Park NeighborhoodEstimated Value: $397,017 - $458,000
3
Beds
2
Baths
1,438
Sq Ft
$294/Sq Ft
Est. Value
About This Home
This home is located at 983 Lansmere Ln, Columbus, OH 43220 and is currently estimated at $422,754, approximately $293 per square foot. 983 Lansmere Ln is a home located in Franklin County with nearby schools including Winterset Elementary School, Ridgeview Middle School, and Centennial High School.
Ownership History
Date
Name
Owned For
Owner Type
Purchase Details
Closed on
Oct 3, 2019
Sold by
Thomasson Adele A and Thomasson Michael E
Bought by
Thomasson Holdings Llc
Current Estimated Value
Purchase Details
Closed on
Sep 21, 2018
Sold by
Donovan Lorna F and The Ferguson Family Trust
Bought by
Thomasson Adele A and Thomasson Michael E
Home Financials for this Owner
Home Financials are based on the most recent Mortgage that was taken out on this home.
Original Mortgage
$178,000
Outstanding Balance
$154,907
Interest Rate
4.5%
Mortgage Type
New Conventional
Estimated Equity
$267,847
Purchase Details
Closed on
Jun 1, 2015
Sold by
Ferguson Shirley L
Bought by
Donovan Lorna F and Ferguson Family Trust
Purchase Details
Closed on
Jul 26, 1991
Bought by
Ferguson Shirley L
Purchase Details
Closed on
Dec 1, 1986
Purchase Details
Closed on
May 1, 1986
Create a Home Valuation Report for This Property
The Home Valuation Report is an in-depth analysis detailing your home's value as well as a comparison with similar homes in the area
Home Values in the Area
Average Home Value in this Area
Purchase History
| Date | Buyer | Sale Price | Title Company |
|---|---|---|---|
| Thomasson Holdings Llc | -- | None Available | |
| Thomasson Adele A | $222,500 | None Available | |
| Donovan Lorna F | -- | Attorney | |
| Ferguson Shirley L | $109,000 | -- | |
| -- | $76,500 | -- | |
| -- | $76,500 | -- |
Source: Public Records
Mortgage History
| Date | Status | Borrower | Loan Amount |
|---|---|---|---|
| Open | Thomasson Adele A | $178,000 |
Source: Public Records
Tax History Compared to Growth
Tax History
| Year | Tax Paid | Tax Assessment Tax Assessment Total Assessment is a certain percentage of the fair market value that is determined by local assessors to be the total taxable value of land and additions on the property. | Land | Improvement |
|---|---|---|---|---|
| 2024 | $5,026 | $109,660 | $44,630 | $65,030 |
| 2023 | $4,963 | $109,660 | $44,630 | $65,030 |
| 2022 | $4,650 | $87,500 | $23,730 | $63,770 |
| 2021 | $4,658 | $87,500 | $23,730 | $63,770 |
| 2020 | $4,751 | $87,500 | $23,730 | $63,770 |
| 2019 | $4,177 | $67,170 | $23,730 | $43,440 |
| 2018 | $3,146 | $67,170 | $23,730 | $43,440 |
| 2017 | $3,542 | $67,170 | $23,730 | $43,440 |
| 2016 | $3,035 | $54,570 | $19,320 | $35,250 |
| 2015 | $2,802 | $54,570 | $19,320 | $35,250 |
| 2014 | $2,762 | $54,570 | $19,320 | $35,250 |
| 2013 | $1,285 | $51,975 | $18,410 | $33,565 |
Source: Public Records
Map
Nearby Homes
- 1109 Millcreek Ln
- 1206 Kenbrook Hills Dr
- 745 Highland Dr
- 1016 Lambeth Dr
- 1060 Woodmere Rd
- 1059 Lambeth Dr
- 3526 Rue de Fleur Unit B18U
- 1121 Afton Rd
- 1315 La Rochelle Dr Unit B2U
- 1311 La Rochelle Dr Unit B2L
- 1225 Brittany Ln
- 1310 Stoneygate Ln
- 4200 Rudy Rd
- 3311 Mansion Way
- 4319 Kenmont Place
- 4273 Rudy Rd
- 1560 Pemberton Dr
- 1360 Langston Dr
- 1033 Folkestone Rd
- 1098 Stanhope Dr
- 991 Lansmere Ln
- 975 Lansmere Ln
- 990 Birchmont Rd
- 963 Lansmere Ln
- 1000 Birchmont Rd
- 999 Lansmere Ln
- 982 Birchmont Rd
- 984 Lansmere Ln
- 1010 Birchmont Rd
- 976 Lansmere Ln
- 974 Birchmont Rd
- 992 Lansmere Ln
- 955 Lansmere Ln
- 1007 Lansmere Ln
- 1018 Birchmont Rd
- 1000 Lansmere Ln
- 966 Birchmont Rd
- 956 Lansmere Ln
- 947 Lansmere Ln
- 1019 Lansmere Ln