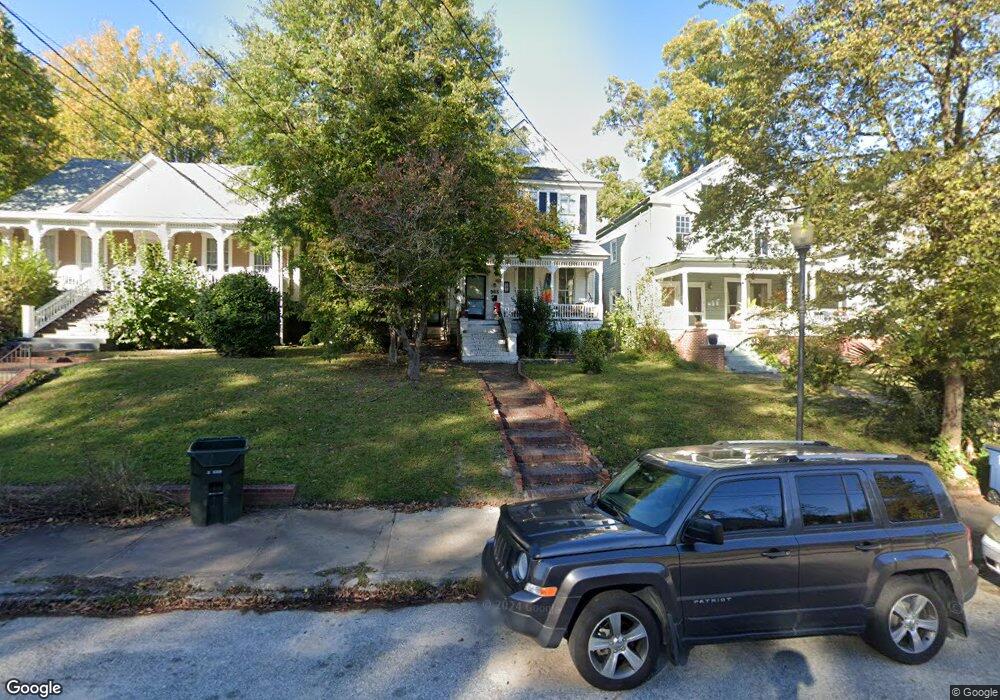
983 Magnolia St Macon, GA 31201
InTown NeighborhoodEstimated Value: $158,000 - $251,000
5
Beds
3
Baths
2,684
Sq Ft
$74/Sq Ft
Est. Value
About This Home
This home is located at 983 Magnolia St, Macon, GA 31201 and is currently estimated at $198,507, approximately $73 per square foot. 983 Magnolia St is a home with nearby schools including Williams Elementary School, Miller Fine Arts Magnet Middle School, and Central High School.
Ownership History
Date
Name
Owned For
Owner Type
Purchase Details
Closed on
Nov 6, 2018
Sold by
Meadows Brian Kevin
Bought by
Imperial Resource Group Llc
Current Estimated Value
Home Financials for this Owner
Home Financials are based on the most recent Mortgage that was taken out on this home.
Original Mortgage
$117,000
Outstanding Balance
$102,472
Interest Rate
4.8%
Mortgage Type
Unknown
Estimated Equity
$96,035
Purchase Details
Closed on
May 16, 2017
Sold by
Meadows Martin Daniel
Bought by
Meadows B Kevin and Meadows Brian Kevin
Purchase Details
Closed on
Jan 26, 2005
Sold by
Hall Meadows Martin D and Hall Meadows Sheila
Bought by
Meadows Brian Kevin
Purchase Details
Closed on
May 23, 2000
Purchase Details
Closed on
Mar 29, 2000
Create a Home Valuation Report for This Property
The Home Valuation Report is an in-depth analysis detailing your home's value as well as a comparison with similar homes in the area
Home Values in the Area
Average Home Value in this Area
Purchase History
| Date | Buyer | Sale Price | Title Company |
|---|---|---|---|
| Imperial Resource Group Llc | $57,000 | None Available | |
| Meadows B Kevin | -- | None Available | |
| Meadows Brian Kevin | -- | None Available | |
| -- | $69,000 | -- | |
| -- | $53,500 | -- |
Source: Public Records
Mortgage History
| Date | Status | Borrower | Loan Amount |
|---|---|---|---|
| Open | Imperial Resource Group Llc | $117,000 |
Source: Public Records
Tax History Compared to Growth
Tax History
| Year | Tax Paid | Tax Assessment Tax Assessment Total Assessment is a certain percentage of the fair market value that is determined by local assessors to be the total taxable value of land and additions on the property. | Land | Improvement |
|---|---|---|---|---|
| 2025 | $837 | $34,070 | $8,235 | $25,835 |
| 2024 | $865 | $34,070 | $8,235 | $25,835 |
| 2023 | $957 | $37,695 | $3,300 | $34,395 |
| 2022 | $1,540 | $44,482 | $14,588 | $29,894 |
| 2021 | $1,351 | $35,565 | $12,685 | $22,880 |
| 2020 | $1,323 | $34,077 | $12,685 | $21,392 |
| 2019 | $1,909 | $34,077 | $12,685 | $21,392 |
| 2018 | $3,619 | $57,365 | $12,685 | $44,680 |
| 2017 | $2,149 | $57,365 | $12,685 | $44,680 |
| 2016 | $1,985 | $57,366 | $12,685 | $44,680 |
| 2015 | $2,809 | $57,366 | $12,685 | $44,680 |
| 2014 | $3,231 | $57,366 | $12,685 | $44,680 |
Source: Public Records
Map
Nearby Homes
- 975 Magnolia St
- 991 Magnolia St Unit 3
- 991 Magnolia St Unit 2
- 991 Magnolia St Unit 1
- 991 Magnolia St
- 967 Magnolia St Unit 1
- 967 Magnolia St Unit 2
- 967 Magnolia St
- 967 Magnolia St Unit 3
- 967 Magnolia St Unit 4
- 1007 Magnolia St
- 1015 Magnolia St
- 957 Magnolia St
- 0 Magnolia St Unit 8846895
- 0 Magnolia St Unit 8763114
- 0 Magnolia St Unit 8400884
- 994 Magnolia St
- 972 Magnolia St
- 974 Cherry St
- 1006 Magnolia St