983 W 1055 N Orem, UT 84057
Bonneville NeighborhoodEstimated Value: $293,842 - $301,000
2
Beds
1
Bath
987
Sq Ft
$300/Sq Ft
Est. Value
About This Home
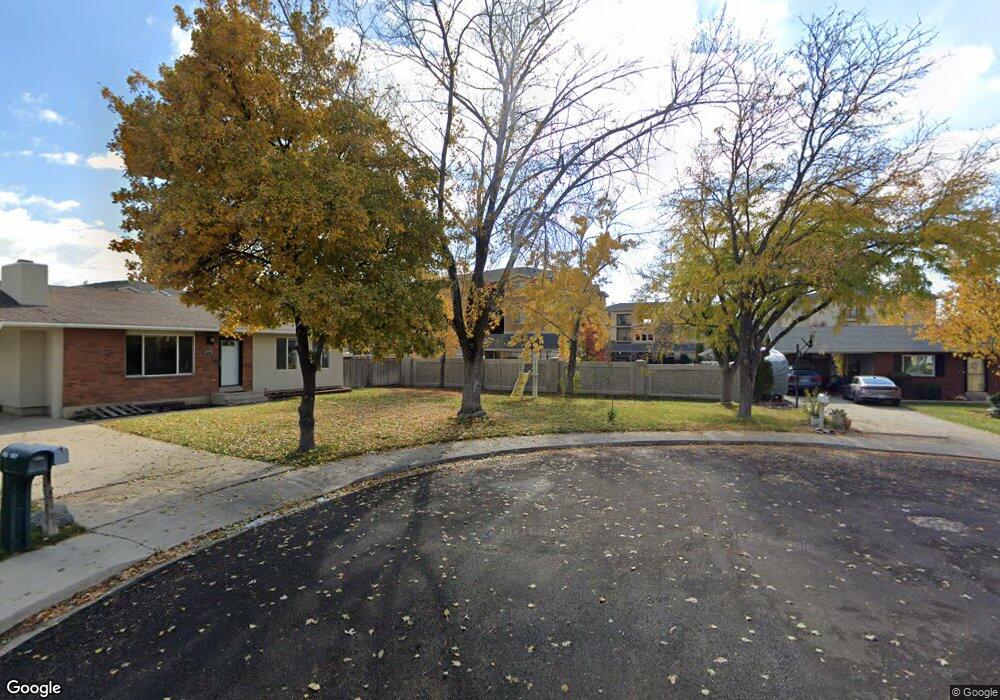
This home is located at 983 W 1055 N, Orem, UT 84057 and is currently estimated at $296,281, approximately $300 per square foot. 983 W 1055 N is a home located in Utah County with nearby schools including Bonneville Elementary School, Orem Junior High School, and Timpanogos High School.
Ownership History
Date
Name
Owned For
Owner Type
Purchase Details
Closed on
Dec 29, 2022
Sold by
Hainsworth Jason
Bought by
Jth Family Investments Llc
Current Estimated Value
Purchase Details
Closed on
Oct 28, 2016
Sold by
Hainsworth Jason E and Hainsworth Tiffany D
Bought by
Hainsworth Jason and Hainsworth Tiffany D
Home Financials for this Owner
Home Financials are based on the most recent Mortgage that was taken out on this home.
Original Mortgage
$124,100
Interest Rate
3.48%
Mortgage Type
New Conventional
Purchase Details
Closed on
Aug 24, 2009
Sold by
K C West Development Lc
Bought by
Hainsworth Jason E and Do Tiffany
Home Financials for this Owner
Home Financials are based on the most recent Mortgage that was taken out on this home.
Original Mortgage
$135,401
Interest Rate
5.17%
Mortgage Type
FHA
Create a Home Valuation Report for This Property
The Home Valuation Report is an in-depth analysis detailing your home's value as well as a comparison with similar homes in the area
Home Values in the Area
Average Home Value in this Area
Purchase History
| Date | Buyer | Sale Price | Title Company |
|---|---|---|---|
| Jth Family Investments Llc | -- | -- | |
| Hainsworth Jason | -- | Provo Land Title Co | |
| Hainsworth Jason E | -- | Provo Land Title Company |
Source: Public Records
Mortgage History
| Date | Status | Borrower | Loan Amount |
|---|---|---|---|
| Previous Owner | Hainsworth Jason | $124,100 | |
| Previous Owner | Hainsworth Jason E | $135,401 |
Source: Public Records
Tax History
| Year | Tax Paid | Tax Assessment Tax Assessment Total Assessment is a certain percentage of the fair market value that is determined by local assessors to be the total taxable value of land and additions on the property. | Land | Improvement |
|---|---|---|---|---|
| 2025 | $1,253 | $153,725 | -- | -- |
| 2024 | $1,253 | $153,175 | $0 | $0 |
| 2023 | $1,100 | $144,595 | $0 | $0 |
| 2022 | $1,121 | $142,780 | $0 | $0 |
| 2021 | $1,056 | $203,600 | $24,400 | $179,200 |
| 2020 | $959 | $181,800 | $21,800 | $160,000 |
| 2019 | $887 | $174,800 | $31,300 | $143,500 |
| 2018 | $852 | $160,400 | $31,300 | $129,100 |
| 2017 | $781 | $78,760 | $0 | $0 |
| 2016 | $830 | $77,220 | $0 | $0 |
| 2015 | $844 | $74,250 | $0 | $0 |
| 2014 | $816 | $71,445 | $0 | $0 |
Source: Public Records
Map
Nearby Homes
- 1086 N 1005 W
- 1062 N 1035 W
- 999 W 1100 N
- 930 N 980 W
- 1004 N 1090 W Unit 203
- 1069 N 1160 W
- 1140 W 950 N Unit D302
- 1140 W 950 N Unit D304
- 1123 N 800 W
- 686 N 835 W
- 954 W 630 N Unit 34,
- 1405 N 770 W
- 538 W 1120 N
- 1058 W 570 St N
- 1535 N 950 W
- 545 W 1240 N
- 582 W 1300 N
- 1499 N 1200 W Unit 8
- 1167 W 1550 N
- 875 W 530 N
- 983 W 1055 N
- 983 W 1055 N
- 983 W 1055 N
- 983 W 1055 N
- 983 W 1055 N
- 983 W 1055 N
- 983 W 1055 N
- 983 W 1055 N
- 983 W 1055 N
- 983 W 1055 N
- 983 W 1055 N
- 983 W 1055 N
- 983 W 1055 N
- 983 W 1055 N
- 983 W 1055 N
- 983 W 1055 N Unit 802
- 983 W 1055 N Unit 814
- 983 W 1055 N Unit 808
- 983 W 1055 N Unit 806
- 983 W 1055 N Unit 815
Your Personal Tour Guide
Ask me questions while you tour the home.