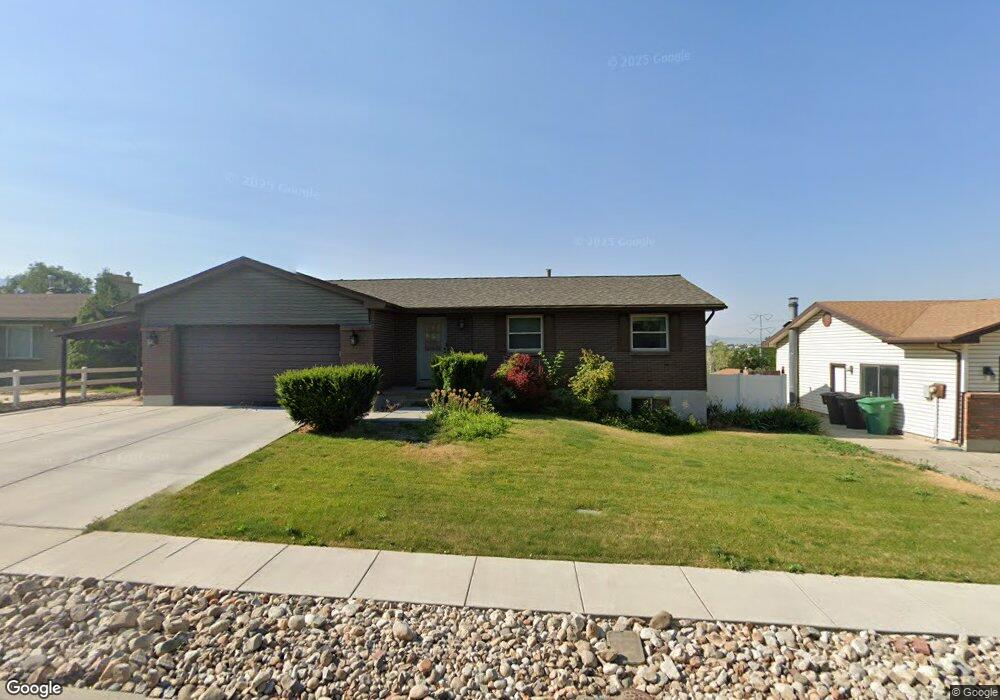
983 W River Point Cir Salt Lake City, UT 84123
Estimated Value: $533,000 - $666,000
6
Beds
2
Baths
2,310
Sq Ft
$252/Sq Ft
Est. Value
About This Home
This home is located at 983 W River Point Cir, Salt Lake City, UT 84123 and is currently estimated at $581,707, approximately $251 per square foot. 983 W River Point Cir is a home located in Salt Lake County with nearby schools including Grant Elementary School, Riverview Junior High School, and Murray High School.
Ownership History
Date
Name
Owned For
Owner Type
Purchase Details
Closed on
May 19, 2020
Sold by
Huggard Lezlie P
Bought by
Cox Dylan and Lundberg Amanda
Current Estimated Value
Home Financials for this Owner
Home Financials are based on the most recent Mortgage that was taken out on this home.
Original Mortgage
$370,500
Outstanding Balance
$328,314
Interest Rate
3.3%
Mortgage Type
New Conventional
Estimated Equity
$253,393
Purchase Details
Closed on
Nov 19, 2019
Sold by
Huggard Alex and Huggard Lezlie P
Bought by
Huggard Lezlie P
Purchase Details
Closed on
Dec 28, 2004
Sold by
Huggard Alex and Huggard Lezlie P
Bought by
Huggard Alex and Huggard Lezlie P
Purchase Details
Closed on
Nov 23, 1993
Sold by
Cook Craig A
Bought by
Cook Craig A and Cook Marian E
Home Financials for this Owner
Home Financials are based on the most recent Mortgage that was taken out on this home.
Original Mortgage
$16,000
Interest Rate
6.74%
Mortgage Type
Purchase Money Mortgage
Create a Home Valuation Report for This Property
The Home Valuation Report is an in-depth analysis detailing your home's value as well as a comparison with similar homes in the area
Home Values in the Area
Average Home Value in this Area
Purchase History
| Date | Buyer | Sale Price | Title Company |
|---|---|---|---|
| Cox Dylan | -- | Real Advantage Ttl Ins Agcy | |
| Huggard Lezlie P | -- | None Available | |
| Huggard Alex | -- | -- | |
| Cook Craig A | -- | Associated Title |
Source: Public Records
Mortgage History
| Date | Status | Borrower | Loan Amount |
|---|---|---|---|
| Open | Cox Dylan | $370,500 | |
| Previous Owner | Cook Craig A | $16,000 |
Source: Public Records
Tax History Compared to Growth
Tax History
| Year | Tax Paid | Tax Assessment Tax Assessment Total Assessment is a certain percentage of the fair market value that is determined by local assessors to be the total taxable value of land and additions on the property. | Land | Improvement |
|---|---|---|---|---|
| 2025 | $2,411 | $554,100 | $168,400 | $385,700 |
| 2024 | $2,411 | $534,800 | $162,700 | $372,100 |
| 2023 | $2,292 | $486,800 | $150,700 | $336,100 |
| 2022 | $2,463 | $497,400 | $147,800 | $349,600 |
| 2021 | $2,139 | $380,900 | $118,200 | $262,700 |
| 2020 | $1,887 | $318,000 | $86,700 | $231,300 |
| 2019 | $1,918 | $312,300 | $86,700 | $225,600 |
| 2018 | $1,636 | $271,800 | $84,700 | $187,100 |
| 2017 | $1,483 | $248,400 | $84,700 | $163,700 |
| 2016 | $1,350 | $218,300 | $84,700 | $133,600 |
| 2015 | $1,669 | $245,200 | $95,300 | $149,900 |
| 2014 | $1,595 | $232,300 | $91,100 | $141,200 |
Source: Public Records
Map
Nearby Homes
- 5834 Walden Ridge Dr
- 903 W Bullion St
- 913 W Bullion St Unit 10
- 910 W Brandermill Cove
- 937 Coalburn Way Unit 102
- 931 Coalburn Way Unit 102
- 923 Coalburn Way Unit 103
- Hirst 2 Plan at The Gallery at Bullion - Townhomes
- Caro 2 Plan at The Gallery at Bullion - Townhomes
- Sargent Plan at The Gallery at Bullion - Single Family Homes
- Gomez Plan at The Gallery at Bullion - Single Family Homes
- Dexter Plan at The Gallery at Bullion - Single Family Homes
- 924 Coalburn Way Unit 8-26
- 912 W Bellshill Dr Unit 15
- 909 W Bullion St Unit 11
- 1193 W Dun Robin Ct
- 6080 S 700 W
- 5964 S 610 W
- 5517 S White Springs Dr
- 5504 S White Springs Dr
- 983 River Point Cir
- 973 River Point Cir
- 973 W River Point Cir
- 995 River Point Cir
- 5907 River Point Cir
- 982 Potomac Cir
- 972 Potomac Cir
- 963 River Point Cir
- 986 W River Point Cir
- 5915 River Point Cir
- 986 River Point Cir
- 974 River Point Cir
- 962 Potomac Cir
- 996 W River Point Cir
- 996 River Point Cir
- 964 River Point Cir
- 953 River Point
- 5906 River Point
- 953 River Point Cir
- 953 W River Point Cir