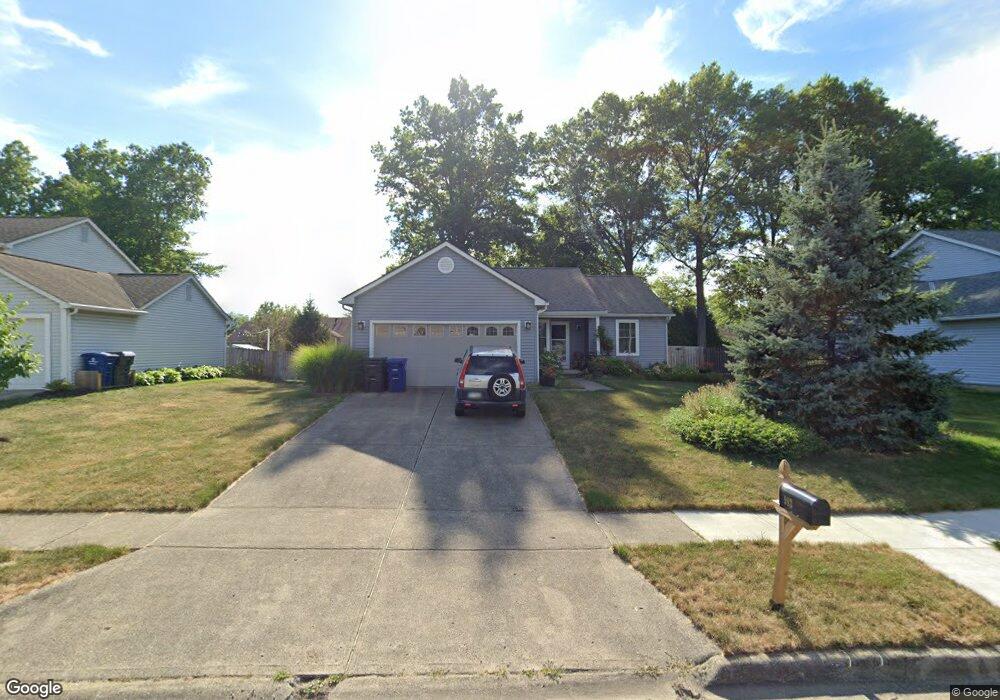
983 Windbourne St Columbus, OH 43230
Woodside Green NeighborhoodEstimated Value: $300,250 - $364,000
3
Beds
2
Baths
1,212
Sq Ft
$275/Sq Ft
Est. Value
About This Home
This home is located at 983 Windbourne St, Columbus, OH 43230 and is currently estimated at $332,813, approximately $274 per square foot. 983 Windbourne St is a home located in Franklin County with nearby schools including Chapelfield Elementary School, Gahanna West Middle School, and Lincoln High School.
Ownership History
Date
Name
Owned For
Owner Type
Purchase Details
Closed on
Mar 28, 2006
Sold by
Schroth Cynthia M
Bought by
Dell Dorothy E
Current Estimated Value
Home Financials for this Owner
Home Financials are based on the most recent Mortgage that was taken out on this home.
Original Mortgage
$119,000
Outstanding Balance
$66,937
Interest Rate
6.38%
Mortgage Type
Fannie Mae Freddie Mac
Estimated Equity
$265,876
Purchase Details
Closed on
Dec 9, 2002
Sold by
Spaulding Steven
Bought by
Schroth Cynthia M
Purchase Details
Closed on
May 31, 2001
Sold by
Keller Alix R and Keller Alix R
Bought by
Spaulding Steven
Home Financials for this Owner
Home Financials are based on the most recent Mortgage that was taken out on this home.
Original Mortgage
$121,505
Interest Rate
7.18%
Purchase Details
Closed on
Jul 25, 1997
Sold by
Miller Timmy G and Miller August S
Bought by
Keller Alix R
Purchase Details
Closed on
Oct 3, 1991
Create a Home Valuation Report for This Property
The Home Valuation Report is an in-depth analysis detailing your home's value as well as a comparison with similar homes in the area
Home Values in the Area
Average Home Value in this Area
Purchase History
| Date | Buyer | Sale Price | Title Company |
|---|---|---|---|
| Dell Dorothy E | $159,000 | Chicago Tit | |
| Schroth Cynthia M | $137,500 | Title First Agency Inc | |
| Spaulding Steven | $127,900 | -- | |
| Keller Alix R | $110,000 | Gahanna Title | |
| -- | $92,000 | -- |
Source: Public Records
Mortgage History
| Date | Status | Borrower | Loan Amount |
|---|---|---|---|
| Open | Dell Dorothy E | $119,000 | |
| Previous Owner | Spaulding Steven | $121,505 |
Source: Public Records
Tax History
| Year | Tax Paid | Tax Assessment Tax Assessment Total Assessment is a certain percentage of the fair market value that is determined by local assessors to be the total taxable value of land and additions on the property. | Land | Improvement |
|---|---|---|---|---|
| 2025 | $4,712 | $89,780 | $29,300 | $60,480 |
| 2024 | $4,712 | $89,780 | $29,300 | $60,480 |
| 2023 | $4,689 | $89,775 | $29,295 | $60,480 |
| 2022 | $3,720 | $58,560 | $15,090 | $43,470 |
| 2021 | $3,598 | $58,560 | $15,090 | $43,470 |
| 2020 | $3,567 | $58,560 | $15,090 | $43,470 |
| 2019 | $2,875 | $48,800 | $12,570 | $36,230 |
| 2018 | $2,805 | $48,800 | $12,570 | $36,230 |
| 2017 | $2,696 | $48,800 | $12,570 | $36,230 |
| 2016 | $2,754 | $46,830 | $12,040 | $34,790 |
| 2015 | $2,756 | $46,830 | $12,040 | $34,790 |
| 2014 | $2,735 | $46,830 | $12,040 | $34,790 |
| 2013 | $1,358 | $46,830 | $12,040 | $34,790 |
Source: Public Records
Map
Nearby Homes
- 3455 Halpern St
- 0 Wendler Blvd
- 4672 Sperry Ave
- 956 Crystal Cay Ct
- 3555 Tami Place
- 830 Lindenhaven Rd
- 536 Springwood Lake Dr
- 3877 Hines Rd
- 613 Mistletoe St
- 586 Pinegrove Place
- 167 Greenbank Rd
- 108 Walcreek Dr W
- 475 Denwood Ct
- 3715 Montclair Dr
- 464 Foxwood Dr
- 439 Canterwood Ct
- 299 Sherwood Meadows Dr
- 420 Denwood Ct
- 424 Lincolnshire Rd
- 388 Elkwood Place
- 991 Windbourne St
- 975 Windbourne St
- 3444 Meldrake St
- 3450 Meldrake St
- 967 Windbourne St
- 999 Windbourne St
- 3456 Meldrake St
- 533 Gahanna Highlands Dr
- 491 Bluestem Ave
- 974 Windbourne St
- 959 Windbourne St
- 1007 Windbourne St
- 537 Gahanna Highlands Dr
- 3470 Meldrake St
- 966 Windbourne St
- 1000 Windbourne St
- 3478 Meldrake St
- 951 Windbourne St
- 3453 Meldrake St
- 483 Bluestem Ave
Your Personal Tour Guide
Ask me questions while you tour the home.