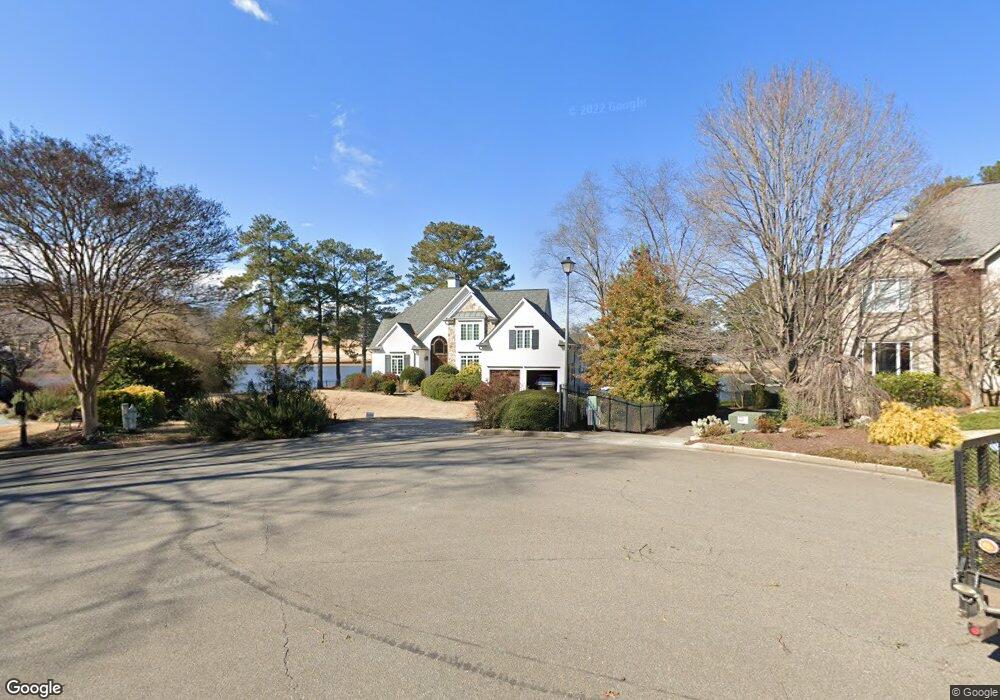
9830 Bankside Dr Unit 16 Roswell, GA 30076
Willow Springs NeighborhoodEstimated Value: $1,011,000 - $1,370,000
4
Beds
4
Baths
3,599
Sq Ft
$337/Sq Ft
Est. Value
About This Home
This home is located at 9830 Bankside Dr Unit 16, Roswell, GA 30076 and is currently estimated at $1,214,144, approximately $337 per square foot. 9830 Bankside Dr Unit 16 is a home located in Fulton County with nearby schools including Northwood Elementary School, Haynes Bridge Middle School, and Centennial High School.
Ownership History
Date
Name
Owned For
Owner Type
Purchase Details
Closed on
Feb 25, 2013
Sold by
Burke Patrick A
Bought by
Mccartney Margaret Y and Mccartney Andrew S
Current Estimated Value
Home Financials for this Owner
Home Financials are based on the most recent Mortgage that was taken out on this home.
Original Mortgage
$301,000
Outstanding Balance
$204,342
Interest Rate
2.72%
Mortgage Type
New Conventional
Estimated Equity
$1,009,802
Purchase Details
Closed on
Jun 29, 1998
Sold by
Gores Rbt E
Bought by
Burke Patricia A and Burke Joanne M
Home Financials for this Owner
Home Financials are based on the most recent Mortgage that was taken out on this home.
Original Mortgage
$284,000
Interest Rate
7.04%
Mortgage Type
New Conventional
Create a Home Valuation Report for This Property
The Home Valuation Report is an in-depth analysis detailing your home's value as well as a comparison with similar homes in the area
Home Values in the Area
Average Home Value in this Area
Purchase History
| Date | Buyer | Sale Price | Title Company |
|---|---|---|---|
| Mccartney Margaret Y | $600,000 | -- | |
| Burke Patricia A | $480,000 | -- |
Source: Public Records
Mortgage History
| Date | Status | Borrower | Loan Amount |
|---|---|---|---|
| Open | Mccartney Margaret Y | $301,000 | |
| Previous Owner | Burke Patricia A | $284,000 |
Source: Public Records
Tax History Compared to Growth
Tax History
| Year | Tax Paid | Tax Assessment Tax Assessment Total Assessment is a certain percentage of the fair market value that is determined by local assessors to be the total taxable value of land and additions on the property. | Land | Improvement |
|---|---|---|---|---|
| 2025 | $2,146 | $448,840 | $120,480 | $328,360 |
| 2023 | $2,146 | $433,640 | $92,720 | $340,920 |
| 2022 | $10,008 | $380,400 | $72,520 | $307,880 |
| 2021 | $11,761 | $369,280 | $70,400 | $298,880 |
| 2020 | $10,728 | $327,600 | $55,880 | $271,720 |
| 2019 | $1,595 | $321,800 | $54,880 | $266,920 |
| 2018 | $8,871 | $314,280 | $53,600 | $260,680 |
| 2017 | $7,391 | $253,320 | $60,360 | $192,960 |
| 2016 | $7,393 | $253,320 | $60,360 | $192,960 |
| 2015 | $8,805 | $253,320 | $60,360 | $192,960 |
| 2014 | $7,254 | $236,640 | $56,400 | $180,240 |
Source: Public Records
Map
Nearby Homes
- 2642 Long Pointe
- 3040 Roxburgh Dr
- 1020 Summer Oaks Close Unit 4
- 440 Guildhall Grove Unit 2
- 10280 Crescent Ridge Dr
- 710 Leeds Garden Terrace
- 1095 Northpointe Trace
- 140 Old Sandhurst Landing
- 1250 Atherton Park
- 3077 Haynes Trail
- 245 Spring Ridge Trace
- 2765 Chandon Place
- 280 Vidaulan Ct
- 585 Saint Regis Ln
- 10085 Old Woodland Entry
- 385 Birch Rill Dr
- 970 Laurel Mill Dr
- 9820 Bankside Dr Unit 16
- 9840 Bankside Dr
- 9850 Bankside Dr Unit 16
- 9845 Bankside Dr
- 9855 Bankside Dr
- 9860 Bankside Dr
- 9865 Bankside Dr
- 9870 Bankside Dr Unit 16
- 9875 Bankside Dr
- 115 Willow Way
- 9900 Terrace Lake Point Unit 24
- 9910 Terrace Lake Point
- 9930 Bankside Dr
- 9920 Bankside Dr Unit 14
- 9910 Bankside Dr Unit 14
- 9940 Bankside Dr
- 9900 Bankside Dr
- 125 Willow Way
- 9890 Terrace Lake Point
- 9880 Bankside Dr