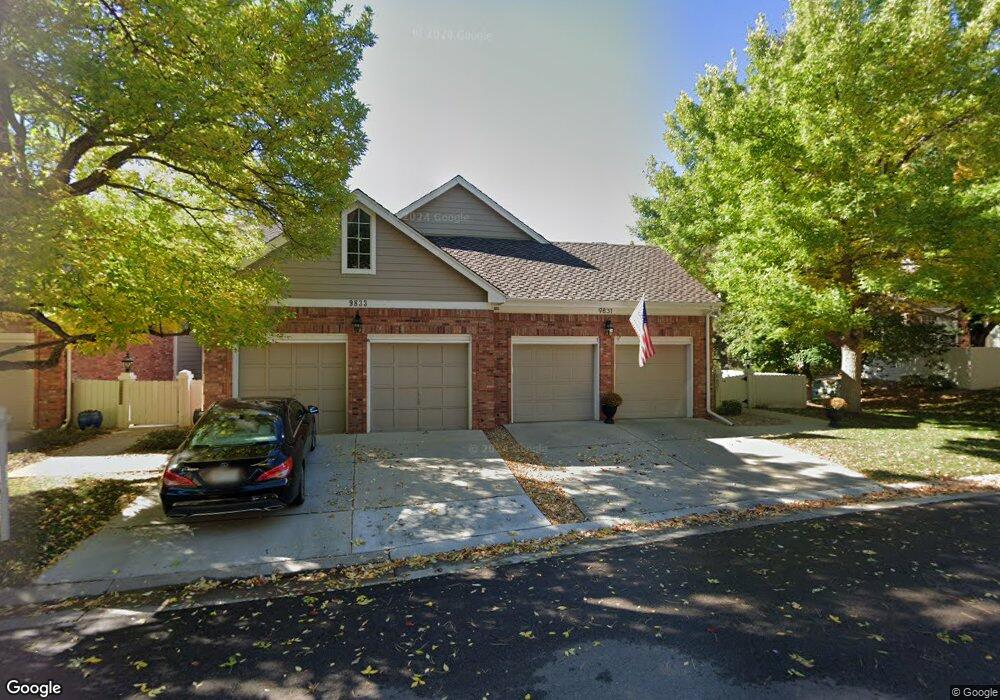
9831 Greensview Cir Lone Tree, CO 80124
Estimated Value: $731,180 - $819,000
3
Beds
3
Baths
3,327
Sq Ft
$234/Sq Ft
Est. Value
About This Home
This home is located at 9831 Greensview Cir, Lone Tree, CO 80124 and is currently estimated at $779,295, approximately $234 per square foot. 9831 Greensview Cir is a home located in Douglas County with nearby schools including Acres Green Elementary School, Cresthill Middle School, and Highlands Ranch High School.
Ownership History
Date
Name
Owned For
Owner Type
Purchase Details
Closed on
Mar 31, 2021
Sold by
Fulford Diana P
Bought by
Farnsworth Garrett L
Current Estimated Value
Home Financials for this Owner
Home Financials are based on the most recent Mortgage that was taken out on this home.
Original Mortgage
$560,500
Outstanding Balance
$504,422
Interest Rate
2.8%
Mortgage Type
New Conventional
Estimated Equity
$274,873
Purchase Details
Closed on
Jul 26, 1996
Sold by
Jacobs Daryl E and Jacobs Sheila J
Bought by
Fulford Joseph W and Fulford Diana P
Home Financials for this Owner
Home Financials are based on the most recent Mortgage that was taken out on this home.
Original Mortgage
$207,000
Interest Rate
7.12%
Purchase Details
Closed on
Sep 23, 1991
Sold by
Gill Gordon J and Gill Bonita B
Bought by
Jacobs Daryl E and Jacobs Sheila J
Purchase Details
Closed on
Oct 29, 1986
Sold by
Fairways Douglas Dev Corp
Bought by
Gill Gordon J and Gill Bonita B
Create a Home Valuation Report for This Property
The Home Valuation Report is an in-depth analysis detailing your home's value as well as a comparison with similar homes in the area
Home Values in the Area
Average Home Value in this Area
Purchase History
| Date | Buyer | Sale Price | Title Company |
|---|---|---|---|
| Farnsworth Garrett L | $590,000 | Fidelity National Title | |
| Fulford Joseph W | $265,000 | First American Heritage Titl | |
| Jacobs Daryl E | $186,000 | -- | |
| Gill Gordon J | $227,600 | -- |
Source: Public Records
Mortgage History
| Date | Status | Borrower | Loan Amount |
|---|---|---|---|
| Open | Farnsworth Garrett L | $560,500 | |
| Previous Owner | Fulford Joseph W | $207,000 |
Source: Public Records
Tax History Compared to Growth
Tax History
| Year | Tax Paid | Tax Assessment Tax Assessment Total Assessment is a certain percentage of the fair market value that is determined by local assessors to be the total taxable value of land and additions on the property. | Land | Improvement |
|---|---|---|---|---|
| 2024 | $4,048 | $46,900 | $10,320 | $36,580 |
| 2023 | $4,089 | $46,900 | $10,320 | $36,580 |
| 2022 | $3,501 | $38,500 | $2,920 | $35,580 |
| 2021 | $2,983 | $38,500 | $2,920 | $35,580 |
| 2020 | $2,988 | $39,520 | $3,000 | $36,520 |
| 2019 | $2,998 | $39,520 | $3,000 | $36,520 |
| 2018 | $2,272 | $33,450 | $3,020 | $30,430 |
| 2017 | $2,309 | $33,450 | $3,020 | $30,430 |
| 2016 | $2,339 | $34,010 | $3,340 | $30,670 |
| 2015 | $1,196 | $34,010 | $3,340 | $30,670 |
| 2014 | $1,110 | $30,640 | $3,340 | $27,300 |
Source: Public Records
Map
Nearby Homes
- 9873 Greensview Cir
- 9851 Greensview Cir
- 9838 Cypress Point Cir
- 10884 Lyric St
- 10102 Prestwick Trail
- 10040 Poudre Ct
- 7438 Indian Wells Ln
- 9493 Southern Hills Cir Unit A25
- 7855 Arundel Ln
- 8176 Lone Oak Ct
- 10225 Dunsford Dr
- 9308 Miles Dr Unit 5
- 7469 La Quinta Place
- 9412 La Quinta Way
- 9943 Cottoncreek Dr
- 10205 Bluffmont Dr
- 7146 Newhall Dr
- 7404 La Quinta Ln
- 8159 Lodgepole Trail
- 8260 Lodgepole Trail
- 9835 Greensview Cir
- 9827 Greensview Cir
- 9837 Greensview Cir
- 9825 Greensview Cir
- 9823 Greensview Cir
- 9841 Greensview Cir
- 9883 Greensview Cir
- 9821 Greensview Cir
- 9885 Greensview Cir
- 9881 Greensview Cir
- 9891 Greensview Cir
- 9843 Greensview Cir
- 9893 Greensview Cir
- 9877 Greensview Cir
- 9845 Greensview Cir
- 9895 Greensview Cir
- 9847 Greensview Cir
- 9871 Greensview Cir
- 9765 Bay Hill Dr
- 9761 Bay Hill Dr