
Seller's Agent in 2012
Terry Kaminski
Windermere Corporate
(360) 701-2711
37 in this area
127 Total Sales

Estimated Value: $442,000 - $485,000
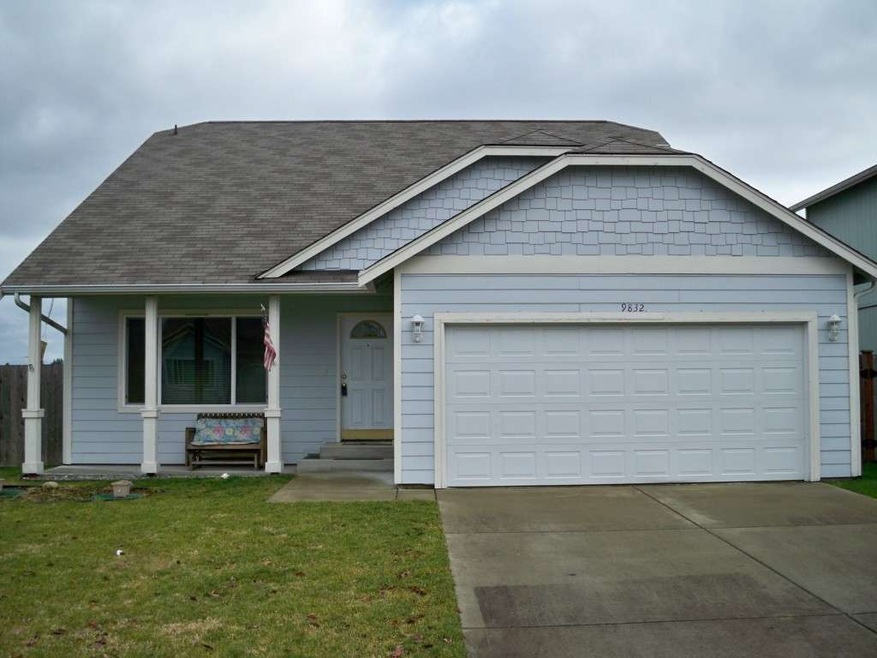
Pristine home in nice Yelm Neighborhood! Nice, flowing floor plan with Main Floor Master! This plan has dramatic cathedral ceilings, two bedrooms upstairs PLUS a den, providing flexible use! Wonderful corner lot with generous garden space, a large deck and retractable awning for those hot summer days! Covered front patio too! Close to schools and all amenities. Easy access to Fort Lewis. This is not a short sale! Seller contributed $6,000 towards buyer's closing costs.
Last Buyer's Agent
Judy Hoover
Paramount Realty, LLC
Source: Northwest Multiple Listing Service (NWMLS)
MLS#: NWM314793
| Date | Buyer | Sale Price | Title Company |
|---|---|---|---|
| Olayvar Herb | $159,120 | Transnation Title |
| Date | Status | Borrower | Loan Amount |
|---|---|---|---|
| Open | Olayvar Herb | $164,350 |
| Date | Event | Price | List to Sale | Price per Sq Ft |
|---|---|---|---|---|
| 05/07/2012 05/07/12 | Sold | $165,000 | 0.0% | $103 / Sq Ft |
| 04/10/2012 04/10/12 | Pending | -- | -- | -- |
| 01/30/2012 01/30/12 | For Sale | $165,000 | -- | $103 / Sq Ft |
| Year | Tax Paid | Tax Assessment Tax Assessment Total Assessment is a certain percentage of the fair market value that is determined by local assessors to be the total taxable value of land and additions on the property. | Land | Improvement |
|---|---|---|---|---|
| 2025 | $3,919 | $449,600 | $142,000 | $307,600 |
| 2024 | $3,919 | $426,500 | $132,400 | $294,100 |
| 2023 | $3,919 | $401,500 | $104,900 | $296,600 |
| 2022 | $3,576 | $405,000 | $73,200 | $331,800 |
| 2021 | $3,343 | $324,800 | $77,800 | $247,000 |
| 2020 | $3,216 | $263,900 | $53,800 | $210,100 |
| 2019 | $2,479 | $248,000 | $48,200 | $199,800 |
| 2018 | $2,717 | $200,400 | $24,100 | $176,300 |
| 2017 | $2,401 | $185,500 | $23,800 | $161,700 |
| 2016 | $2,148 | $167,250 | $30,550 | $136,700 |
| 2014 | -- | $156,550 | $29,350 | $127,200 |
Seller's Agent in 2012
Terry Kaminski
Windermere Corporate
(360) 701-2711
37 in this area
127 Total Sales
J
Buyer's Agent in 2012
Judy Hoover
Paramount Realty, LLC
Source: Northwest Multiple Listing Service (NWMLS)
MLS Number: NWM314793
APN: 84070005900
Disclaimer: Certain information contained herein is derived from information provided by parties other than Homes.com. All information provided is deemed reliable, but is not guaranteed to be accurate and should be independently verified.
![]() All data is obtained from various sources and may not have been verified by broker or MLS GRID. Supplied Open House Information is subject to change without notice. All information should be independently reviewed and verified for accuracy. Properties may or may not be listed by the office/agent presenting the information. Listing information is provided by the Northwest Multiple Listing Service (NWMLS). Property information is based on available data that may include MLS information, county records, and other sources. Listings marked with the 3 tree icon and provided by NWMLS. All properties are subject to prior sale or withdrawal. IDX information is provided exclusively for consumers’ personal noncommercial use, that it may not be used for any purpose other than to identify prospective properties consumers may be interested in purchasing, that the data is deemed reliable but is not guaranteed by MLS GRID. ©2026 NWMLS.
All data is obtained from various sources and may not have been verified by broker or MLS GRID. Supplied Open House Information is subject to change without notice. All information should be independently reviewed and verified for accuracy. Properties may or may not be listed by the office/agent presenting the information. Listing information is provided by the Northwest Multiple Listing Service (NWMLS). Property information is based on available data that may include MLS information, county records, and other sources. Listings marked with the 3 tree icon and provided by NWMLS. All properties are subject to prior sale or withdrawal. IDX information is provided exclusively for consumers’ personal noncommercial use, that it may not be used for any purpose other than to identify prospective properties consumers may be interested in purchasing, that the data is deemed reliable but is not guaranteed by MLS GRID. ©2026 NWMLS.
Based on information submitted to the MLS GRID
Ask me questions while you tour the home.