Estimated Value: $513,000 - $550,051
3
Beds
2
Baths
1,810
Sq Ft
$297/Sq Ft
Est. Value
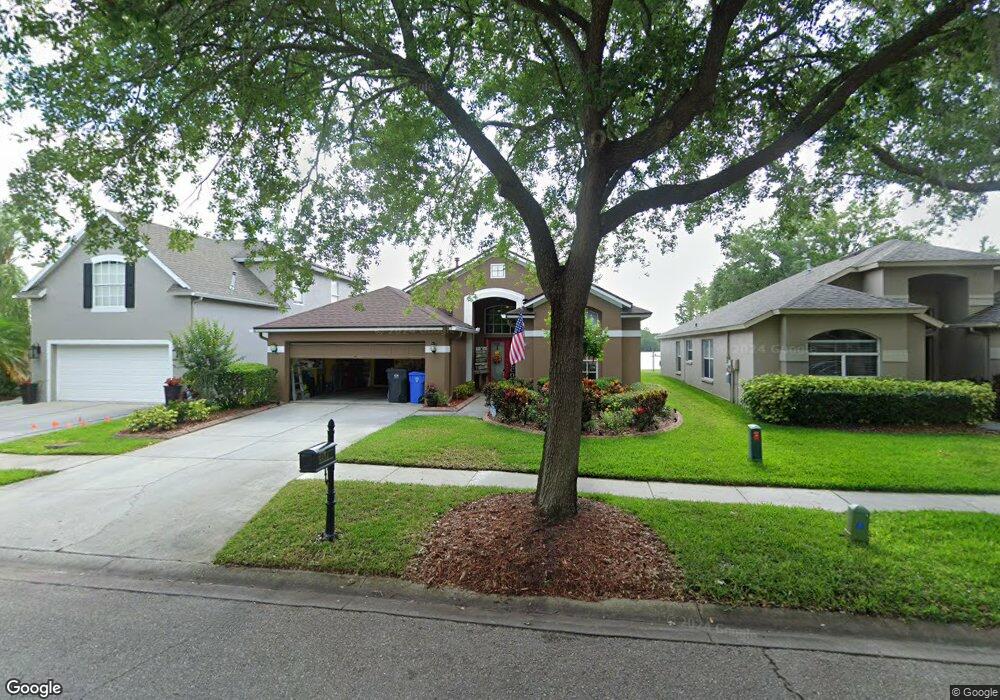
About This Home
This home is located at 9834 Bayboro Bridge Dr, Tampa, FL 33626 and is currently estimated at $537,263, approximately $296 per square foot. 9834 Bayboro Bridge Dr is a home located in Hillsborough County with nearby schools including Westchase Elementary School, Davidsen Middle School, and Alonso High School.
Ownership History
Date
Name
Owned For
Owner Type
Purchase Details
Closed on
Jul 1, 2021
Sold by
Mills James David and Mills Linda Coston
Bought by
Mills James David and Mills Linda Coston
Current Estimated Value
Purchase Details
Closed on
Feb 7, 2001
Sold by
Holiday Rebecca A and Holiday F
Bought by
Mills James D and Mills Linda L
Home Financials for this Owner
Home Financials are based on the most recent Mortgage that was taken out on this home.
Original Mortgage
$21,000
Outstanding Balance
$7,687
Interest Rate
7.09%
Mortgage Type
Credit Line Revolving
Estimated Equity
$529,576
Purchase Details
Closed on
Nov 12, 1996
Sold by
Ih Tampa Homes Corp
Bought by
Holliday Rebecca A
Home Financials for this Owner
Home Financials are based on the most recent Mortgage that was taken out on this home.
Original Mortgage
$100,000
Interest Rate
8.13%
Mortgage Type
New Conventional
Create a Home Valuation Report for This Property
The Home Valuation Report is an in-depth analysis detailing your home's value as well as a comparison with similar homes in the area
Home Values in the Area
Average Home Value in this Area
Purchase History
| Date | Buyer | Sale Price | Title Company |
|---|---|---|---|
| Mills James David | -- | Attorney | |
| Mills James D | $170,000 | -- | |
| Holliday Rebecca A | $138,700 | -- |
Source: Public Records
Mortgage History
| Date | Status | Borrower | Loan Amount |
|---|---|---|---|
| Open | Holliday Rebecca A | $21,000 | |
| Open | Holliday Rebecca A | $136,450 | |
| Previous Owner | Holliday Rebecca A | $100,000 |
Source: Public Records
Tax History Compared to Growth
Tax History
| Year | Tax Paid | Tax Assessment Tax Assessment Total Assessment is a certain percentage of the fair market value that is determined by local assessors to be the total taxable value of land and additions on the property. | Land | Improvement |
|---|---|---|---|---|
| 2024 | $4,674 | $227,110 | -- | -- |
| 2023 | $4,485 | $220,495 | $0 | $0 |
| 2022 | $4,165 | $214,073 | $0 | $0 |
| 2021 | $4,082 | $207,838 | $0 | $0 |
| 2020 | $3,993 | $204,968 | $0 | $0 |
| 2019 | $3,886 | $200,360 | $0 | $0 |
| 2018 | $3,832 | $196,624 | $0 | $0 |
| 2017 | $3,786 | $274,147 | $0 | $0 |
| 2016 | $4,026 | $188,619 | $0 | $0 |
| 2015 | $4,149 | $187,308 | $0 | $0 |
| 2014 | $4,124 | $185,821 | $0 | $0 |
| 2013 | -- | $183,075 | $0 | $0 |
Source: Public Records
Map
Nearby Homes
- 11506 Crowned Sparrow Ln
- 9986 Stockbridge Dr
- 11424 Crowned Sparrow Ln
- 9237 Fox Sparrow Rd
- 9248 Fox Sparrow Rd
- 11604 Crowned Sparrow Ln
- 11617 Crowned Sparrow Ln
- 10364 Lightner Bridge Dr
- 10409 Lightner Bridge Dr
- 9109 Fox Sparrow Rd
- 11722 Crowned Sparrow Ln
- 10464 White Lake Ct Unit 10464
- 10436 White Lake Ct Unit 10436
- 10136 Kingsbridge Ave
- 10430 White Lake Ct Unit 10430
- 10412 White Lake Ct Unit 10406
- 10538 Windsor Lake Ct
- 9604 Lake Chase Island Way
- 9584 Lake Chase Island Way Unit 958
- 9586 Lake Chase Island Way Unit 9586
- 9832 Bayboro Bridge Dr
- 9836 Bayboro Bridge Dr
- 9838 Bayboro Bridge Dr
- 9830 Bayboro Bridge Dr
- 9828 Bayboro Bridge Dr
- 9840 Bayboro Bridge Dr
- 9833 Bayboro Bridge Dr
- 9835 Bayboro Bridge Dr
- 9831 Bayboro Bridge Dr
- 9837 Bayboro Bridge Dr
- 9829 Bayboro Bridge Dr
- 9826 Bayboro Bridge Dr
- 9842 Bayboro Bridge Dr
- 9839 Bayboro Bridge Dr
- 9827 Bayboro Bridge Dr
- 9841 Bayboro Bridge Dr
- 9844 Bayboro Bridge Dr
- 9825 Bayboro Bridge Dr
- 9843 Bayboro Bridge Dr
- 9823 Bayboro Bridge Dr