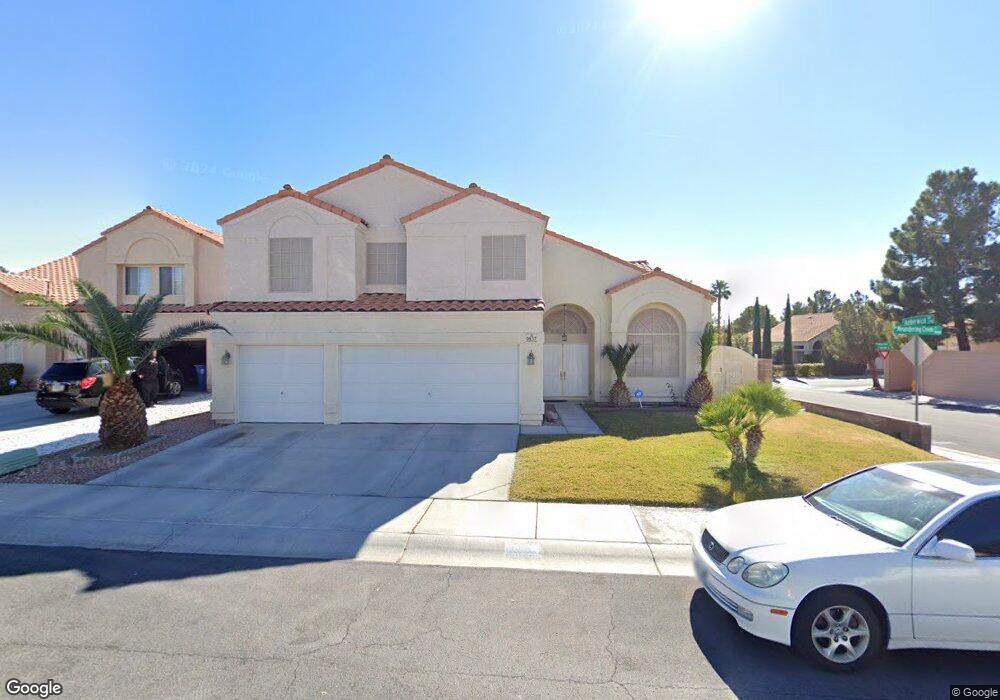
9837 Meandering Creek Ct Unit 1 Las Vegas, NV 89117
The Section Seven NeighborhoodEstimated Value: $646,000 - $792,000
6
Beds
3
Baths
2,971
Sq Ft
$234/Sq Ft
Est. Value
About This Home
This home is located at 9837 Meandering Creek Ct Unit 1, Las Vegas, NV 89117 and is currently estimated at $694,414, approximately $233 per square foot. 9837 Meandering Creek Ct Unit 1 is a home located in Clark County with nearby schools including D'Vorre & Hal Ober Elementary School, Victoria Fertitta Middle School, and Bonanza High School.
Ownership History
Date
Name
Owned For
Owner Type
Purchase Details
Closed on
Mar 31, 2003
Sold by
Ks Nevada Inc
Bought by
Dilovyan Gevork and Dilovyan Hripsime
Current Estimated Value
Home Financials for this Owner
Home Financials are based on the most recent Mortgage that was taken out on this home.
Original Mortgage
$192,000
Outstanding Balance
$82,361
Interest Rate
5.73%
Estimated Equity
$612,053
Purchase Details
Closed on
Dec 30, 2002
Sold by
Timbol Reynaldo and Timbol Emy Jo
Bought by
Ks Nevada Inc
Purchase Details
Closed on
Mar 5, 1994
Sold by
Perlsweig Jarold A and Perlsweig Anne
Bought by
Timbol Reynaldo and Timbol Emy Jo
Home Financials for this Owner
Home Financials are based on the most recent Mortgage that was taken out on this home.
Original Mortgage
$175,250
Interest Rate
7.21%
Create a Home Valuation Report for This Property
The Home Valuation Report is an in-depth analysis detailing your home's value as well as a comparison with similar homes in the area
Home Values in the Area
Average Home Value in this Area
Purchase History
| Date | Buyer | Sale Price | Title Company |
|---|---|---|---|
| Dilovyan Gevork | $240,000 | National Title Company | |
| Ks Nevada Inc | $197,500 | -- | |
| Timbol Reynaldo | $184,500 | Old Republic Title Company | |
| Perlsweig Jarold A | -- | Old Republic Title Company |
Source: Public Records
Mortgage History
| Date | Status | Borrower | Loan Amount |
|---|---|---|---|
| Open | Dilovyan Gevork | $192,000 | |
| Previous Owner | Perlsweig Jarold A | $175,250 |
Source: Public Records
Tax History Compared to Growth
Tax History
| Year | Tax Paid | Tax Assessment Tax Assessment Total Assessment is a certain percentage of the fair market value that is determined by local assessors to be the total taxable value of land and additions on the property. | Land | Improvement |
|---|---|---|---|---|
| 2025 | $3,194 | $136,002 | $44,468 | $91,534 |
| 2024 | $3,101 | $136,002 | $44,468 | $91,534 |
| 2023 | $3,101 | $131,841 | $44,100 | $87,741 |
| 2022 | $3,011 | $113,370 | $32,340 | $81,030 |
| 2021 | $2,923 | $107,298 | $29,768 | $77,530 |
| 2020 | $2,835 | $106,383 | $29,033 | $77,350 |
| 2019 | $2,753 | $101,469 | $24,623 | $76,846 |
| 2018 | $2,672 | $98,109 | $23,888 | $74,221 |
| 2017 | $3,247 | $99,044 | $23,153 | $75,891 |
| 2016 | $2,531 | $93,903 | $17,640 | $76,263 |
| 2015 | $2,525 | $77,128 | $12,495 | $64,633 |
| 2014 | $2,452 | $72,556 | $9,188 | $63,368 |
Source: Public Records
Map
Nearby Homes
- 2821 Willow Wind Ct
- 9708 Blazing Star Ct
- 2728 Monrovia Dr
- 2724 Monrovia Dr
- 2704 Messina Ct
- 9724 Cascade Falls Ave
- 2909 Ivory Reef Ct
- 3001 Bridge Creek St
- 9544 Lazy River Dr
- 9713 Cascade Falls Ave
- 2300 Storkspur Way
- 2630 Wind Spinner St
- 9717 Sierra Mesa Ave
- 2701 Purtell Cir
- 2112 Marble Gorge Dr
- 2153 Jade Creek St Unit 106
- 2152 Quarry Ridge St Unit 207
- 9624 Beach Water Cir
- 2112 Preakness Pass Unit A
- 9605 Blowing Sand Cir
- 9833 Meandering Creek Ct Unit 1
- 9901 Meandering Creek Ct
- 9829 Meandering Creek Ct
- 9833 Biscayne Ln
- 9836 Meandering Creek Ct
- 9840 Meandering Creek Ct
- 9832 Meandering Creek Ct
- 9905 Meandering Creek Ct
- 9829 Biscayne Ln
- 9901 Biscayne Ln
- 9825 Meandering Creek Ct
- 9828 Meandering Creek Ct Unit 1
- 9909 Meandering Creek Ct Unit 1
- 9825 Biscayne Ln
- 9904 Meandering Creek Ct
- 9905 Biscayne Ln
- 2733 Dune Cove Rd
- 9908 Meandering Creek Ct
- 9912 Biscayne Ln
- 9912 Biscayne Ln Unit na