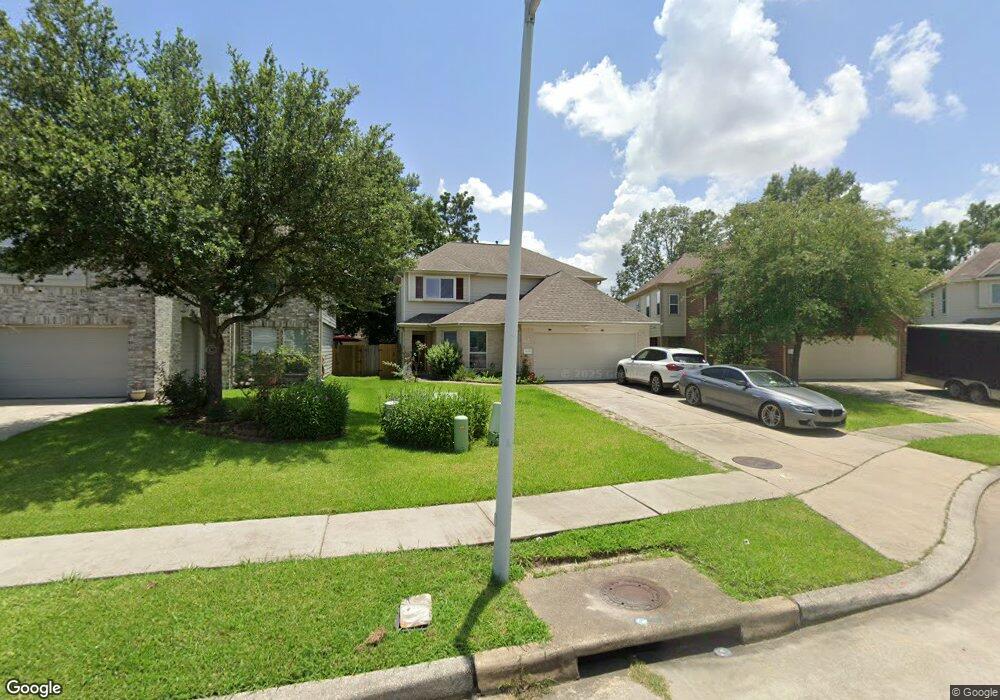
9838 Wing St Conroe, TX 77385
Estimated Value: $272,000 - $325,000
4
Beds
3
Baths
2,232
Sq Ft
$131/Sq Ft
Est. Value
About This Home
This home is located at 9838 Wing St, Conroe, TX 77385 and is currently estimated at $293,489, approximately $131 per square foot. 9838 Wing St is a home located in Montgomery County with nearby schools including Suchma Elementary School, Irons J High School, and Oak Ridge High School.
Ownership History
Date
Name
Owned For
Owner Type
Purchase Details
Closed on
Sep 21, 2018
Sold by
Levy Gil
Bought by
Kulagin Vladimir and Kulagina Iryna
Current Estimated Value
Home Financials for this Owner
Home Financials are based on the most recent Mortgage that was taken out on this home.
Original Mortgage
$164,465
Outstanding Balance
$143,128
Interest Rate
4.5%
Mortgage Type
FHA
Estimated Equity
$150,361
Purchase Details
Closed on
Jun 22, 2011
Sold by
Levy Gil and Levy Avian
Bought by
Levy Gil
Purchase Details
Closed on
Feb 19, 2008
Sold by
Long Lake Ltd
Bought by
Levy Gil and Levy Avian
Home Financials for this Owner
Home Financials are based on the most recent Mortgage that was taken out on this home.
Original Mortgage
$118,235
Interest Rate
5.68%
Mortgage Type
Purchase Money Mortgage
Purchase Details
Closed on
Mar 14, 2007
Sold by
Woodmere Development Co Ltd
Bought by
Levy Gil
Create a Home Valuation Report for This Property
The Home Valuation Report is an in-depth analysis detailing your home's value as well as a comparison with similar homes in the area
Home Values in the Area
Average Home Value in this Area
Purchase History
| Date | Buyer | Sale Price | Title Company |
|---|---|---|---|
| Kulagin Vladimir | -- | Dhi Title | |
| Levy Gil | -- | -- | |
| Levy Gil | -- | American Title Co | |
| Levy Gil | -- | -- |
Source: Public Records
Mortgage History
| Date | Status | Borrower | Loan Amount |
|---|---|---|---|
| Open | Kulagin Vladimir | $164,465 | |
| Previous Owner | Levy Gil | $118,235 |
Source: Public Records
Tax History Compared to Growth
Tax History
| Year | Tax Paid | Tax Assessment Tax Assessment Total Assessment is a certain percentage of the fair market value that is determined by local assessors to be the total taxable value of land and additions on the property. | Land | Improvement |
|---|---|---|---|---|
| 2025 | $6,176 | $281,662 | $42,500 | $239,162 |
| 2024 | $6,176 | $278,097 | $42,500 | $235,597 |
| 2023 | $6,436 | $289,650 | $42,500 | $247,150 |
| 2022 | $5,444 | $265,370 | $42,500 | $222,870 |
| 2021 | $5,440 | $208,540 | $42,500 | $166,040 |
| 2020 | $5,274 | $191,210 | $25,170 | $166,040 |
| 2019 | $5,205 | $180,450 | $16,030 | $164,420 |
| 2018 | $4,695 | $162,780 | $16,030 | $146,750 |
| 2017 | $4,784 | $162,780 | $16,030 | $146,750 |
| 2016 | $4,542 | $154,560 | $16,030 | $146,750 |
| 2015 | $3,618 | $140,510 | $16,030 | $135,520 |
| 2014 | $3,618 | $127,740 | $16,030 | $120,040 |
Source: Public Records
Map
Nearby Homes
- 9881 Youpon Ridge Way
- 16859 Blackberry Lily Ln
- 16937 Larkspur
- 16916 Tableland Trail
- 9903 Valance Way
- 16731 Foursquare Dr
- 9915 Valance Way
- 9807 Toucan Ln
- 16957 Glen Eagle Dr
- 9877 Lace Flower Way
- 9838 Bobolink Dr
- 16778 N Gull Dr
- 32457 Soaring Willow Way
- 9976 Cassowary Dr
- 16771 N Rail Dr
- 123 Genesee Ridge Dr
- 9972 Western Ridge Way
- 16774 Fallen Timbers Dr
- 9977 Western Ridge Way
- 16751 N Rail Dr
- 9842 Wing St
- 9834 Wing St
- 9846 Wing St
- 9845 Youpon Ridge Way
- 9849 Youpon Ridge Way
- 9830 Wing St
- 9841 Youpon Ridge Way
- 9853 Youpon Ridge Way
- 9850 Wing St
- 16893 Greenhouse St
- 16888 Greenhouse St
- 9857 Youpon Ridge Way
- 16889 Greenhouse St
- 16920 Scenic Knoll
- 16885 Greenhouse St
- 9854 Wing St
- 9861 Youpon Ridge Way
- 16884 Greenhouse St
- 16890 Blackberry Lily Ln
- 9858 Wing St