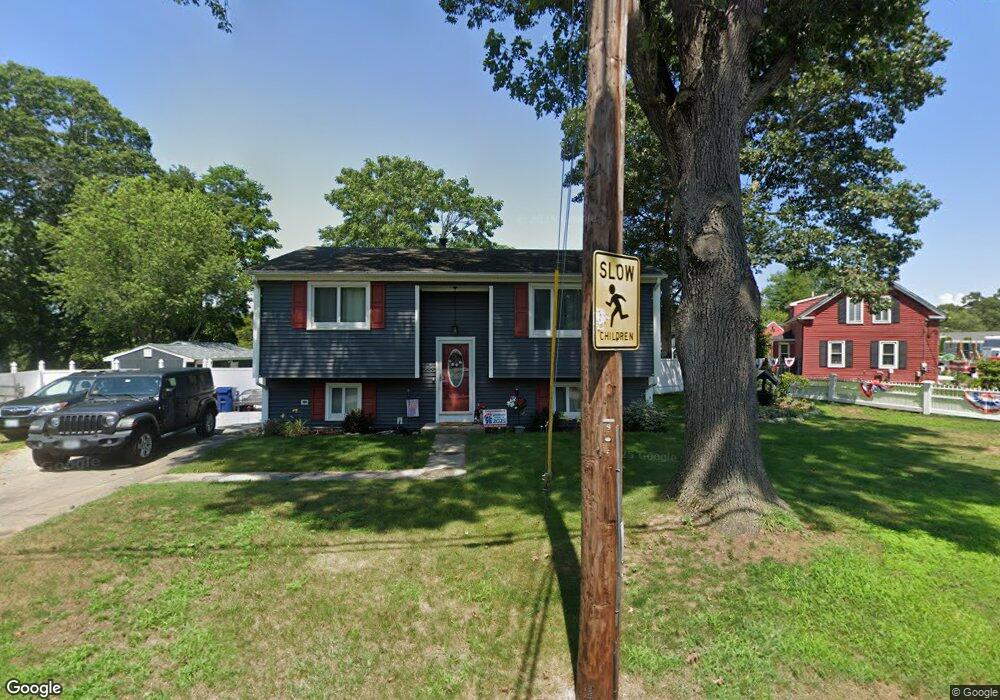
984 Cedar Swamp Rd Warwick, RI 02889
Hoxie NeighborhoodEstimated Value: $377,000 - $430,493
2
Beds
1
Bath
1,324
Sq Ft
$304/Sq Ft
Est. Value
About This Home
This home is located at 984 Cedar Swamp Rd, Warwick, RI 02889 and is currently estimated at $402,123, approximately $303 per square foot. 984 Cedar Swamp Rd is a home located in Kent County with nearby schools including Saint Kevin School and Bishop Hendricken High School.
Ownership History
Date
Name
Owned For
Owner Type
Purchase Details
Closed on
Oct 25, 2019
Sold by
Sabatelli Jennifer and Sabatelli Gerald
Bought by
Sabatelli Jennifer and Sabatelli Gerald
Current Estimated Value
Home Financials for this Owner
Home Financials are based on the most recent Mortgage that was taken out on this home.
Original Mortgage
$185,000
Outstanding Balance
$118,178
Interest Rate
3.1%
Mortgage Type
New Conventional
Estimated Equity
$283,945
Purchase Details
Closed on
Dec 30, 2002
Sold by
Farina Wayne J and Farina Rebecca S
Bought by
Orr Jennifer and Sabutelli Gerald
Home Financials for this Owner
Home Financials are based on the most recent Mortgage that was taken out on this home.
Original Mortgage
$157,500
Interest Rate
6.02%
Mortgage Type
Purchase Money Mortgage
Create a Home Valuation Report for This Property
The Home Valuation Report is an in-depth analysis detailing your home's value as well as a comparison with similar homes in the area
Home Values in the Area
Average Home Value in this Area
Purchase History
| Date | Buyer | Sale Price | Title Company |
|---|---|---|---|
| Sabatelli Jennifer | -- | -- | |
| Orr Jennifer | $158,000 | -- |
Source: Public Records
Mortgage History
| Date | Status | Borrower | Loan Amount |
|---|---|---|---|
| Open | Sabatelli Jennifer | $185,000 | |
| Previous Owner | Orr Jennifer | $189,903 | |
| Previous Owner | Orr Jennifer | $15,000 | |
| Previous Owner | Orr Jennifer | $13,000 | |
| Previous Owner | Orr Jennifer | $157,500 |
Source: Public Records
Tax History
| Year | Tax Paid | Tax Assessment Tax Assessment Total Assessment is a certain percentage of the fair market value that is determined by local assessors to be the total taxable value of land and additions on the property. | Land | Improvement |
|---|---|---|---|---|
| 2025 | $4,774 | $375,900 | $137,500 | $238,400 |
| 2024 | $4,654 | $321,600 | $119,500 | $202,100 |
| 2023 | $4,564 | $321,600 | $119,500 | $202,100 |
| 2022 | $4,319 | $230,600 | $88,900 | $141,700 |
| 2021 | $4,319 | $230,600 | $88,900 | $141,700 |
| 2020 | $4,319 | $230,600 | $88,900 | $141,700 |
| 2019 | $4,319 | $230,600 | $88,900 | $141,700 |
| 2018 | $4,192 | $207,100 | $106,700 | $100,400 |
| 2017 | $4,192 | $207,100 | $106,700 | $100,400 |
| 2016 | $4,192 | $207,100 | $106,700 | $100,400 |
| 2015 | $3,679 | $177,300 | $84,000 | $93,300 |
| 2014 | $3,557 | $177,300 | $84,000 | $93,300 |
| 2013 | $3,509 | $177,300 | $84,000 | $93,300 |
Source: Public Records
Map
Nearby Homes
- 207 Stillwater Dr
- 700 Sandy Ln Unit 3
- 700 Sandy Ln Unit 5
- 700 Sandy Ln Unit 19
- 700 Sandy Ln Unit 4
- 700 Sandy Ln Unit 20
- 700 Sandy Ln Unit 2
- 211 Pinnery Ave
- 18 Sevilla Ave
- 64 Ormsby Ave
- 54 Ansonia Rd
- 112 Old Warwick Ave
- 9 Kenneth Ave
- 72 Hollis Ave
- 0 Bethel St
- 266 Vineyard Rd
- 195 Oakland Beach Ave
- 108 Fern St
- 28 Hoyt St
- 96 Moccasin Dr
- 988 Cedar Swamp Rd
- 976 Cedar Swamp Rd
- 963 Cedar Swamp Rd
- 970 Cedar Swamp Rd
- 107 Marigold Dr
- 1000 Cedar Swamp Rd
- 991 Cedar Swamp Rd
- 97 Marigold Dr
- 1001 Cedar Swamp Rd
- 960 Cedar Swamp Rd
- 87 Marigold Dr
- 110 Elite Dr
- 110 Marigold Dr
- 100 Marigold Dr
- 120 Marigold Dr
- 947 Cedar Swamp Rd
- 88 Marigold Dr
- 77 Marigold Dr
- 100 Elite Dr
- 1021 Cedar Swamp Rd
Your Personal Tour Guide
Ask me questions while you tour the home.