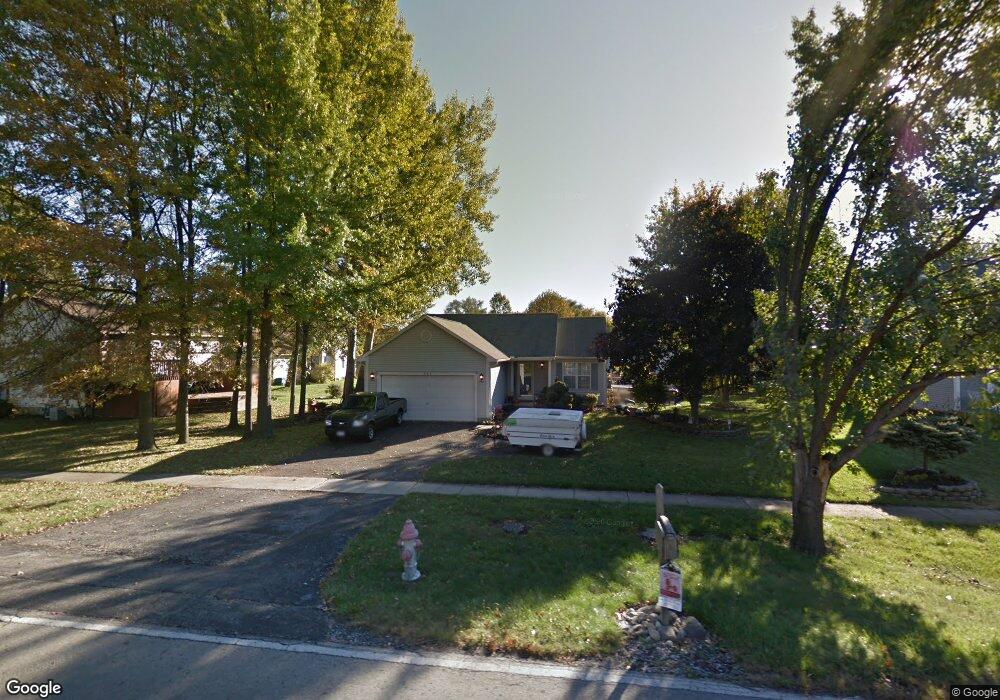
984 Hines Rd Columbus, OH 43230
Woodside Green NeighborhoodEstimated Value: $327,000 - $390,000
3
Beds
2
Baths
1,701
Sq Ft
$212/Sq Ft
Est. Value
About This Home
This home is located at 984 Hines Rd, Columbus, OH 43230 and is currently estimated at $359,920, approximately $211 per square foot. 984 Hines Rd is a home located in Franklin County with nearby schools including Royal Manor Elementary School, Gahanna West Middle School, and Lincoln High School.
Ownership History
Date
Name
Owned For
Owner Type
Purchase Details
Closed on
Oct 22, 2014
Sold by
Rocchi Dominick L and Rocchi Lori Anderson
Bought by
Rocchi Dominick L and Rocchi Lori Anderson
Current Estimated Value
Home Financials for this Owner
Home Financials are based on the most recent Mortgage that was taken out on this home.
Original Mortgage
$74,000
Outstanding Balance
$700
Interest Rate
4.23%
Mortgage Type
Purchase Money Mortgage
Estimated Equity
$359,220
Purchase Details
Closed on
Apr 4, 1995
Sold by
Koons Gerald L
Bought by
Rocchi Dominick L and Rocchi Victoria M
Home Financials for this Owner
Home Financials are based on the most recent Mortgage that was taken out on this home.
Original Mortgage
$91,650
Interest Rate
8.91%
Mortgage Type
New Conventional
Purchase Details
Closed on
Jun 3, 1993
Purchase Details
Closed on
Mar 22, 1991
Create a Home Valuation Report for This Property
The Home Valuation Report is an in-depth analysis detailing your home's value as well as a comparison with similar homes in the area
Home Values in the Area
Average Home Value in this Area
Purchase History
| Date | Buyer | Sale Price | Title Company |
|---|---|---|---|
| Rocchi Dominick L | -- | None Available | |
| Rocchi Dominick L | $96,500 | -- | |
| -- | $94,000 | -- | |
| -- | $87,000 | -- |
Source: Public Records
Mortgage History
| Date | Status | Borrower | Loan Amount |
|---|---|---|---|
| Open | Rocchi Dominick L | $74,000 | |
| Closed | Rocchi Dominick L | $91,650 |
Source: Public Records
Tax History Compared to Growth
Tax History
| Year | Tax Paid | Tax Assessment Tax Assessment Total Assessment is a certain percentage of the fair market value that is determined by local assessors to be the total taxable value of land and additions on the property. | Land | Improvement |
|---|---|---|---|---|
| 2024 | $6,073 | $103,080 | $28,420 | $74,660 |
| 2023 | $5,996 | $103,080 | $28,420 | $74,660 |
| 2022 | $5,447 | $72,940 | $14,980 | $57,960 |
| 2021 | $5,268 | $72,940 | $14,980 | $57,960 |
| 2020 | $5,224 | $72,940 | $14,980 | $57,960 |
| 2019 | $4,362 | $60,770 | $12,500 | $48,270 |
| 2018 | $4,293 | $60,770 | $12,500 | $48,270 |
| 2017 | $4,128 | $60,770 | $12,500 | $48,270 |
| 2016 | $4,253 | $58,800 | $12,600 | $46,200 |
| 2015 | $4,256 | $58,800 | $12,600 | $46,200 |
| 2014 | $4,223 | $58,800 | $12,600 | $46,200 |
| 2013 | $2,097 | $58,800 | $12,600 | $46,200 |
Source: Public Records
Map
Nearby Homes
- 3555 Tami Place
- 3544 Halpern St
- 638 Thistle Ave
- 0 Wendler Blvd
- 3150 Berkley Pointe Dr
- 3118 Berkley Pointe Dr
- 459 Bluestem Ave
- 3877 Hines Rd
- 402 Bluestem Ave
- 536 Springwood Lake Dr
- 3715 Montclair Dr
- 3707 Montclair Dr
- 642 Ridenour Rd
- 4125 Emerius Dr
- 2741 Acarie Dr
- 200 Glenhurst Ct
- 388 Elkwood Place
- 343 Amesbury Dr
- 167 Greenbank Rd
- 111 Nob Hill Dr N
- 976 Hines Rd
- 671 Gahanna Highlands Dr
- 645 Gahanna Highlands Dr
- 665 Gahanna Highlands Dr
- 651 Gahanna Highlands Dr
- 968 Hines Rd
- 641 Gahanna Highlands Dr
- 4546 Blue Largo Ct
- 4547 Boca Ct
- 4540 Blue Largo Ct
- 960 Hines Rd
- 4545 Blue Largo Ct
- 4543 Boca Ct
- 672 Gahanna Highlands Dr
- 4536 Blue Largo Ct
- 668 Gahanna Highlands Dr
- 644 Gahanna Highlands Dr
- 4539 Blue Largo Ct
- 4539 Boca Ct
- 638 Gahanna Highlands Dr