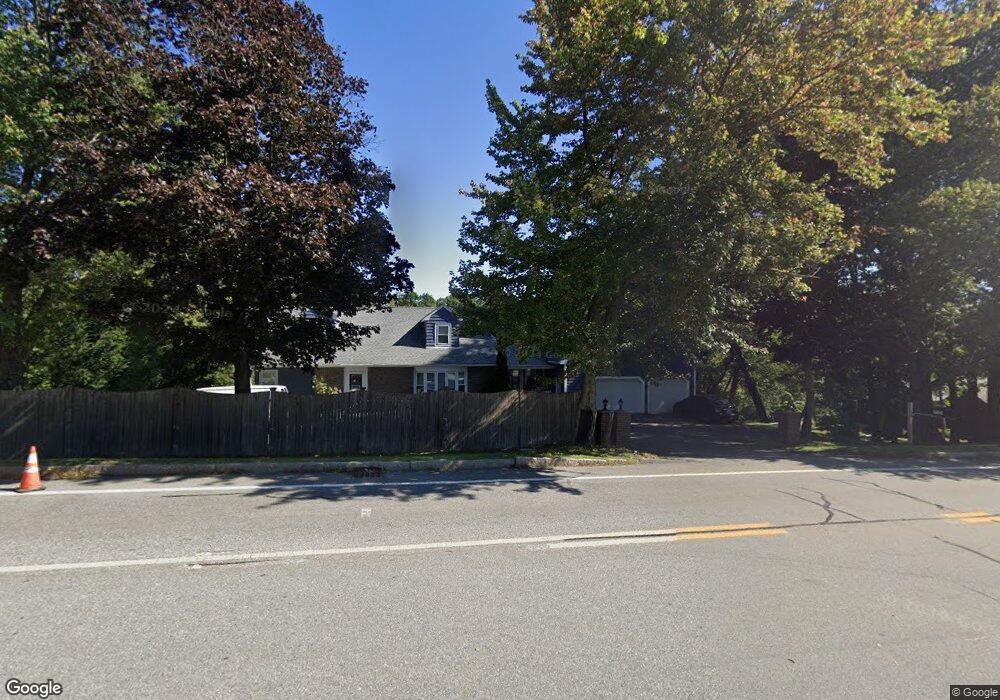
984 Turnpike St North Andover, MA 01845
Estimated Value: $776,000 - $906,000
4
Beds
3
Baths
2,036
Sq Ft
$408/Sq Ft
Est. Value
About This Home
This home is located at 984 Turnpike St, North Andover, MA 01845 and is currently estimated at $830,929, approximately $408 per square foot. 984 Turnpike St is a home located in Essex County with nearby schools including Annie L Sargent Elementary School, North Andover Middle School, and North Andover High School.
Ownership History
Date
Name
Owned For
Owner Type
Purchase Details
Closed on
Jan 29, 2010
Sold by
Lam Vinh P
Bought by
Dockham 2Nd David L
Current Estimated Value
Purchase Details
Closed on
May 20, 2004
Sold by
Newell Robert D and Doran Sandra
Bought by
Lam Vinh P and Lam Vivian
Purchase Details
Closed on
May 30, 1996
Sold by
Moynihan Daniel R
Bought by
Newell Robert D
Create a Home Valuation Report for This Property
The Home Valuation Report is an in-depth analysis detailing your home's value as well as a comparison with similar homes in the area
Home Values in the Area
Average Home Value in this Area
Purchase History
| Date | Buyer | Sale Price | Title Company |
|---|---|---|---|
| Dockham 2Nd David L | $316,500 | -- | |
| Lam Vinh P | $402,000 | -- | |
| Newell Robert D | $176,000 | -- |
Source: Public Records
Mortgage History
| Date | Status | Borrower | Loan Amount |
|---|---|---|---|
| Open | Newell Robert D | $286,000 | |
| Closed | Newell Robert D | $15,000 |
Source: Public Records
Tax History Compared to Growth
Tax History
| Year | Tax Paid | Tax Assessment Tax Assessment Total Assessment is a certain percentage of the fair market value that is determined by local assessors to be the total taxable value of land and additions on the property. | Land | Improvement |
|---|---|---|---|---|
| 2025 | $6,997 | $621,400 | $317,300 | $304,100 |
| 2024 | $6,789 | $612,200 | $298,800 | $313,400 |
| 2023 | $6,055 | $494,700 | $226,300 | $268,400 |
| 2022 | $5,976 | $441,700 | $203,400 | $238,300 |
| 2021 | $6,001 | $423,500 | $185,200 | $238,300 |
| 2020 | $5,691 | $414,200 | $185,200 | $229,000 |
| 2019 | $5,554 | $414,200 | $185,200 | $229,000 |
| 2018 | $6,018 | $414,200 | $185,200 | $229,000 |
| 2017 | $5,485 | $384,100 | $146,500 | $237,600 |
| 2016 | $5,405 | $378,800 | $143,800 | $235,000 |
| 2015 | $5,205 | $361,700 | $141,500 | $220,200 |
Source: Public Records
Map
Nearby Homes