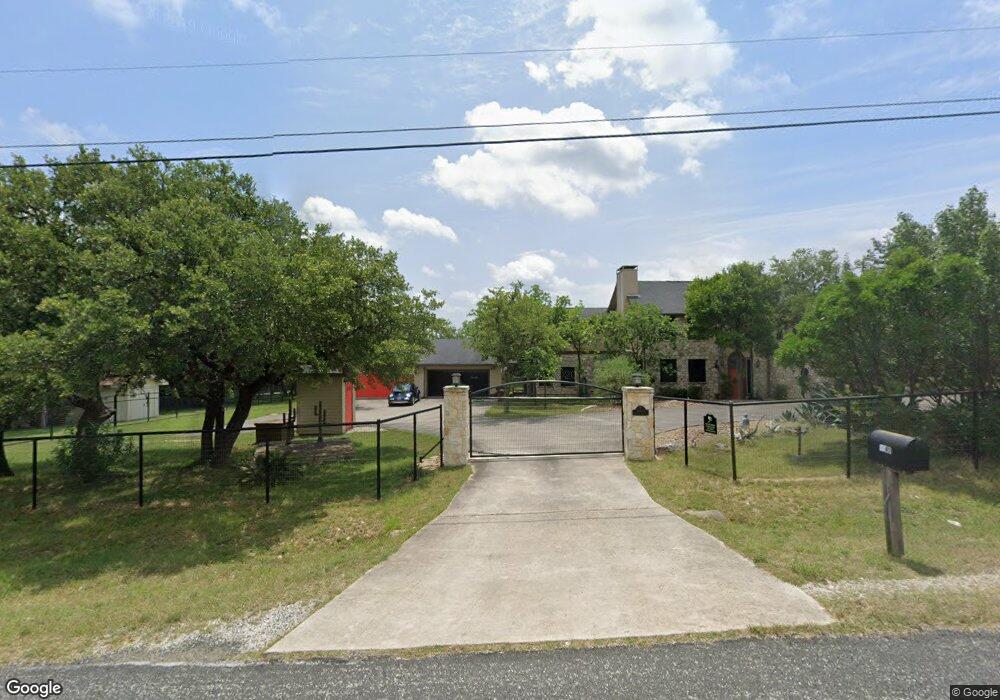
9840 Dos Cerros Loop E Boerne, TX 78006
Scenic Oaks NeighborhoodEstimated Value: $705,511 - $777,000
4
Beds
5
Baths
3,538
Sq Ft
$207/Sq Ft
Est. Value
About This Home
This home is located at 9840 Dos Cerros Loop E, Boerne, TX 78006 and is currently estimated at $731,128, approximately $206 per square foot. 9840 Dos Cerros Loop E is a home located in Bexar County with nearby schools including Kendall Elementary School, Boerne Middle School South, and Samuel V. Champion High School.
Ownership History
Date
Name
Owned For
Owner Type
Purchase Details
Closed on
May 17, 2013
Sold by
Hart Robert V and Hart Wynell M
Bought by
Suter Thaddeus L and Campos Pamela E
Current Estimated Value
Purchase Details
Closed on
Jun 8, 2005
Sold by
Smith Robert Wyatt and Smith Sharon E
Bought by
Hart Robert and Hart Wynell M
Home Financials for this Owner
Home Financials are based on the most recent Mortgage that was taken out on this home.
Original Mortgage
$260,000
Interest Rate
5.79%
Mortgage Type
Fannie Mae Freddie Mac
Purchase Details
Closed on
Jul 18, 1995
Sold by
Thomas Roy Wayne and Thomas Dann
Bought by
Smith Robert Wyatt and Smith Sharon E
Home Financials for this Owner
Home Financials are based on the most recent Mortgage that was taken out on this home.
Original Mortgage
$199,410
Interest Rate
7.54%
Mortgage Type
Assumption
Purchase Details
Closed on
Jun 8, 1994
Sold by
Garza Thomas Diane L
Bought by
Thomas Roy Wayne
Create a Home Valuation Report for This Property
The Home Valuation Report is an in-depth analysis detailing your home's value as well as a comparison with similar homes in the area
Home Values in the Area
Average Home Value in this Area
Purchase History
| Date | Buyer | Sale Price | Title Company |
|---|---|---|---|
| Suter Thaddeus L | -- | None Available | |
| Hart Robert | -- | Chicago Title | |
| Smith Robert Wyatt | -- | Commerce Land Title | |
| Thomas Roy Wayne | -- | -- |
Source: Public Records
Mortgage History
| Date | Status | Borrower | Loan Amount |
|---|---|---|---|
| Previous Owner | Hart Robert | $260,000 | |
| Previous Owner | Smith Robert Wyatt | $199,410 |
Source: Public Records
Tax History
| Year | Tax Paid | Tax Assessment Tax Assessment Total Assessment is a certain percentage of the fair market value that is determined by local assessors to be the total taxable value of land and additions on the property. | Land | Improvement |
|---|---|---|---|---|
| 2025 | $5,671 | $589,753 | $144,130 | $482,670 |
| 2024 | $5,671 | $536,139 | $144,130 | $492,190 |
| 2023 | $5,671 | $487,399 | $144,130 | $492,190 |
| 2022 | $8,862 | $443,090 | $120,110 | $474,730 |
| 2021 | $8,070 | $402,809 | $95,200 | $313,800 |
| 2020 | $7,628 | $366,190 | $86,710 | $285,290 |
| 2019 | $7,175 | $332,900 | $86,710 | $246,190 |
| 2018 | $7,329 | $340,000 | $86,710 | $253,290 |
| 2017 | $7,393 | $348,000 | $51,750 | $296,250 |
| 2016 | $6,799 | $320,045 | $51,750 | $270,250 |
| 2015 | $5,449 | $290,950 | $51,750 | $270,000 |
| 2014 | $5,449 | $264,500 | $0 | $0 |
Source: Public Records
Map
Nearby Homes
- 9845 Dos Cerros Loop E
- 9627 Boerne Haze
- 9833 Saxet Dr
- 9803 Saxet Dr
- 28035 Axis Dr
- 28515 Saxet Dr
- 10007 Grandview Rd
- 27525 Golden Crest
- 27522 Golden Crest
- 27420 Lovat Way
- 10019 Grandview Rd
- 27240 Boerne Glen
- 10027 Grandview Rd
- 27510 Golden Crest
- 27409 Lovat Way
- 10016 Rebecca Place
- 10156 Axis Cir
- 27416 Lovat Way
- 27513 Golden Crescent
- 9826 Creek
- 9832 Dos Cerros Loop E
- 9848 Dos Cerros Loop E
- LOT 243 Dos Cerros Loop E
- 10046 Dos Cerros Loop E
- 9835 Dos Cerros Dr
- 9854 Dos Cerros Loop E
- 9851 Dos Cerros Loop E
- 28212 Dos Cerros Loop E
- 9683 Windwood Dr
- 9859 Dos Cerros Loop E
- 9830 Dos Cerros Dr
- 9876 Dos Cerros Loop E
- 9681 Windwood Dr
- 9677 Windwood Dr
- 9912 Dos Cerros Dr
- 28225 Dos Cerros Loop E
- 28228 Dos Cerros Loop E
- 9877 Dos Cerros Loop E
- 9827 Dos Cerros Dr
- 9707 Windwood Dr
Your Personal Tour Guide
Ask me questions while you tour the home.