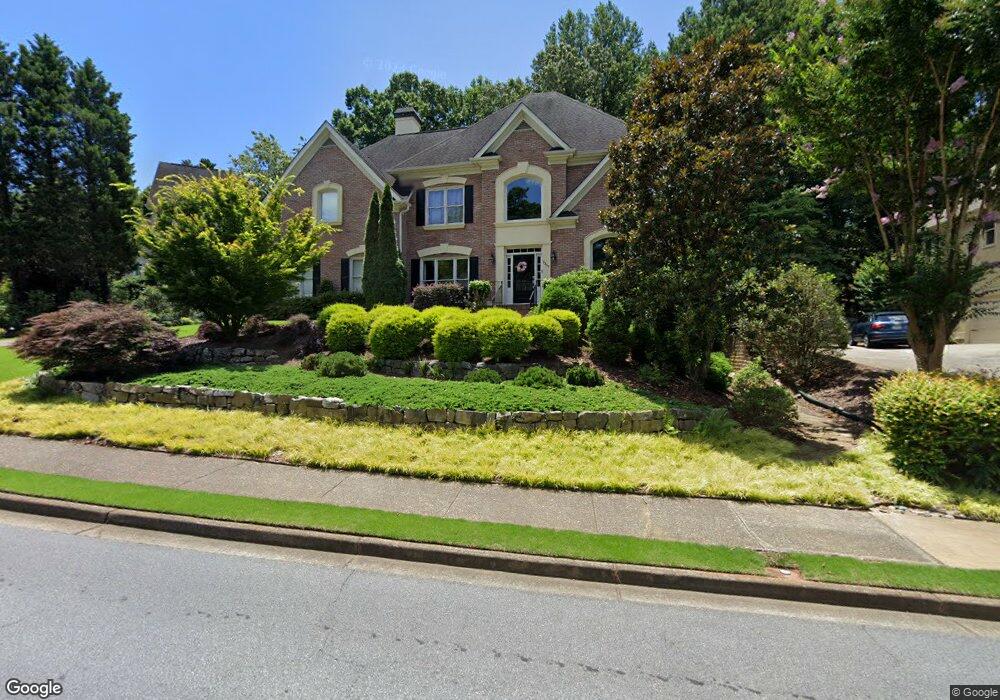
9845 Rod Rd Unit 1 Alpharetta, GA 30022
Newtown NeighborhoodEstimated Value: $917,998 - $1,001,000
5
Beds
5
Baths
5,493
Sq Ft
$172/Sq Ft
Est. Value
About This Home
This home is located at 9845 Rod Rd Unit 1, Alpharetta, GA 30022 and is currently estimated at $947,000, approximately $172 per square foot. 9845 Rod Rd Unit 1 is a home located in Fulton County with nearby schools including Hillside Elementary School, Haynes Bridge Middle School, and Centennial High School.
Ownership History
Date
Name
Owned For
Owner Type
Purchase Details
Closed on
May 6, 2020
Sold by
Sekman Robert
Bought by
Sekman Robert and Aekman Megan
Current Estimated Value
Home Financials for this Owner
Home Financials are based on the most recent Mortgage that was taken out on this home.
Original Mortgage
$389,000
Outstanding Balance
$308,889
Interest Rate
3.3%
Mortgage Type
New Conventional
Estimated Equity
$638,111
Purchase Details
Closed on
May 20, 2016
Sold by
Curran Jacqueline A
Bought by
Sekman Robert
Home Financials for this Owner
Home Financials are based on the most recent Mortgage that was taken out on this home.
Original Mortgage
$415,200
Interest Rate
3.59%
Mortgage Type
New Conventional
Purchase Details
Closed on
Mar 15, 1995
Sold by
Lincoln Dev Corp
Bought by
Curran John D Jacqueline
Create a Home Valuation Report for This Property
The Home Valuation Report is an in-depth analysis detailing your home's value as well as a comparison with similar homes in the area
Home Values in the Area
Average Home Value in this Area
Purchase History
| Date | Buyer | Sale Price | Title Company |
|---|---|---|---|
| Sekman Robert | -- | -- | |
| Sekman Robert | $519,000 | -- | |
| Curran John D Jacqueline | $301,000 | -- |
Source: Public Records
Mortgage History
| Date | Status | Borrower | Loan Amount |
|---|---|---|---|
| Open | Sekman Robert | $389,000 | |
| Previous Owner | Sekman Robert | $415,200 | |
| Closed | Curran John D Jacqueline | $0 |
Source: Public Records
Tax History Compared to Growth
Tax History
| Year | Tax Paid | Tax Assessment Tax Assessment Total Assessment is a certain percentage of the fair market value that is determined by local assessors to be the total taxable value of land and additions on the property. | Land | Improvement |
|---|---|---|---|---|
| 2025 | $5,080 | $300,640 | $95,280 | $205,360 |
| 2023 | $8,070 | $285,920 | $138,000 | $147,920 |
| 2022 | $6,849 | $242,640 | $71,840 | $170,800 |
| 2021 | $4,824 | $206,640 | $54,800 | $151,840 |
| 2020 | $4,859 | $203,640 | $60,080 | $143,560 |
| 2019 | $586 | $180,120 | $51,680 | $128,440 |
| 2018 | $5,104 | $175,920 | $50,480 | $125,440 |
| 2017 | $5,232 | $153,720 | $38,880 | $114,840 |
| 2016 | $4,740 | $153,720 | $38,880 | $114,840 |
| 2015 | $4,792 | $153,720 | $38,880 | $114,840 |
| 2014 | $4,599 | $143,440 | $29,080 | $114,360 |
Source: Public Records
Map
Nearby Homes
- 710 Leeds Garden Terrace
- 140 Old Sandhurst Landing
- 440 Guildhall Grove Unit 2
- 280 Vidaulan Ct
- 10085 Old Woodland Entry
- 615 S Preston Ct
- 3450 Merganser Ln
- 585 Saint Regis Ln
- 9675 Almaviva Dr
- 9715 Almaviva Dr
- 130 Forrest View Terrace
- 2642 Long Pointe
- 2765 Chandon Place
- 3077 Haynes Trail
- 3235 Arborwoods Dr
- 595 Oak Alley Way
- 1020 Summer Oaks Close Unit 4
- 9845 Rod Rd
- 9855 Rod Rd
- 9835 Rod Rd Unit 1
- 9825 Rod Rd Unit I
- 9850 Rod Rd Unit 1
- 0 Rod Rd Unit 3214531
- 0 Rod Rd Unit 3177608
- 0 Rod Rd Unit 8818792
- 0 Rod Rd Unit 8428539
- 0 Rod Rd Unit 8353641
- 0 Rod Rd Unit 8190981
- 0 Rod Rd Unit 7576878
- 0 Rod Rd Unit 8593919
- 0 Rod Rd Unit 8180028
- 0 Rod Rd Unit 7441723
- 0 Rod Rd Unit 7057513
- 0 Rod Rd Unit 8252137
- 0 Rod Rd Unit 7572482
- 0 Rod Rd Unit 3231971
- 0 Rod Rd Unit 3128207