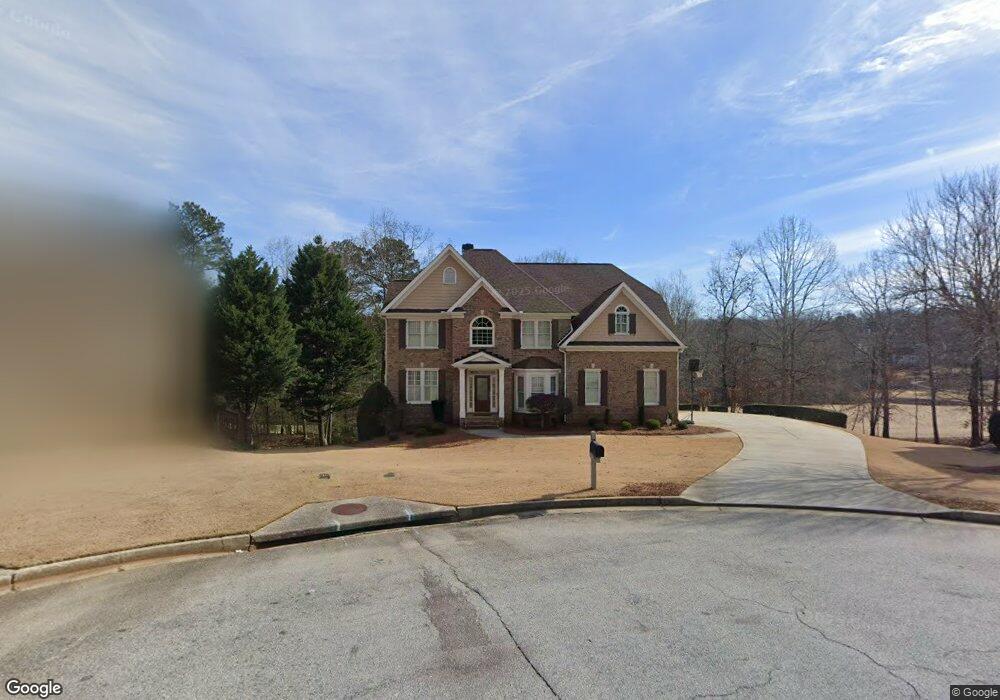
9845 Saint Andrews Ct Douglasville, GA 30135
Estimated Value: $559,000 - $633,000
5
Beds
5
Baths
4,516
Sq Ft
$132/Sq Ft
Est. Value
About This Home
This home is located at 9845 Saint Andrews Ct, Douglasville, GA 30135 and is currently estimated at $595,288, approximately $131 per square foot. 9845 Saint Andrews Ct is a home located in Douglas County with nearby schools including Arbor Station Elementary School, Chapel Hill Middle School, and Chapel Hill High School.
Ownership History
Date
Name
Owned For
Owner Type
Purchase Details
Closed on
Dec 14, 2023
Sold by
Childress-Rodriguez Robin
Bought by
Childress-Rodriguez Robin and Rodriguez Bernadette
Current Estimated Value
Purchase Details
Closed on
Jun 9, 2011
Sold by
Williams David A
Bought by
Childress-Rodrigue Robin
Home Financials for this Owner
Home Financials are based on the most recent Mortgage that was taken out on this home.
Original Mortgage
$292,395
Interest Rate
4.75%
Mortgage Type
FHA
Purchase Details
Closed on
Sep 9, 2005
Sold by
Haven Properties Inc
Bought by
Williams David A
Home Financials for this Owner
Home Financials are based on the most recent Mortgage that was taken out on this home.
Original Mortgage
$329,272
Interest Rate
5.77%
Mortgage Type
New Conventional
Create a Home Valuation Report for This Property
The Home Valuation Report is an in-depth analysis detailing your home's value as well as a comparison with similar homes in the area
Home Values in the Area
Average Home Value in this Area
Purchase History
| Date | Buyer | Sale Price | Title Company |
|---|---|---|---|
| Childress-Rodriguez Robin | -- | None Listed On Document | |
| Childress-Rodrigue Robin | $300,000 | -- | |
| Williams David A | $412,400 | -- |
Source: Public Records
Mortgage History
| Date | Status | Borrower | Loan Amount |
|---|---|---|---|
| Previous Owner | Childress-Rodrigue Robin | $292,395 | |
| Previous Owner | Williams David A | $329,272 |
Source: Public Records
Tax History Compared to Growth
Tax History
| Year | Tax Paid | Tax Assessment Tax Assessment Total Assessment is a certain percentage of the fair market value that is determined by local assessors to be the total taxable value of land and additions on the property. | Land | Improvement |
|---|---|---|---|---|
| 2024 | $10,511 | $255,560 | $40,480 | $215,080 |
| 2023 | $10,511 | $255,560 | $40,480 | $215,080 |
| 2022 | $7,393 | $182,240 | $23,000 | $159,240 |
| 2021 | $6,348 | $155,880 | $21,360 | $134,520 |
| 2020 | $6,451 | $155,480 | $19,520 | $135,960 |
| 2019 | $5,899 | $150,120 | $19,520 | $130,600 |
| 2018 | $5,783 | $146,160 | $19,520 | $126,640 |
| 2017 | $5,666 | $141,720 | $21,160 | $120,560 |
| 2016 | $5,487 | $134,800 | $21,160 | $113,640 |
| 2015 | $5,173 | $130,760 | $21,160 | $109,600 |
| 2014 | $5,173 | $126,000 | $21,600 | $104,400 |
| 2013 | -- | $104,240 | $17,920 | $86,320 |
Source: Public Records
Map
Nearby Homes
- 4799 Winterview Ln
- 9904 Hamilton Dr
- 3439 Emily Place
- 3151 N Woods Trail
- 3180 S Elizabeth Dr
- 3455 Whitney Ct
- 9877 Milton Ct
- 6217 Millstone Trail Unit 1
- 3492 Heatherwood Ct
- 3492 Pine Grove Dr
- 4887 Winterview Ln
- 3535 Fairgreen Ct
- 5823 Sarazen Trail
- 3113 Melissa Ct
- 4625 Fox Hollow Ct
- Richard II Plan at Walters Creek - Executive Series
- Reynold Plan at Walters Creek - Executive Series
- Benjamin II Plan at Walters Creek - Executive Series
- Alexander Plan at Walters Creek - Executive Series
- 9843 Saint Andrews Ct
- 9844 Saint Andrews Ct Unit 2
- 9842 St Andrews Ct
- 9841 St Andrews
- 9842 Saint Andrews Ct
- 9841 Saint Andrews Ct Unit 64
- 9841 Saint Andrews Ct
- 6081 Kingston Dr
- 0 Saint Andrews Ct Unit 8452023
- 0 Saint Andrews Ct Unit 8060875
- 0 Saint Andrews Ct Unit 8164108
- 0 Saint Andrews Ct Unit 7320701
- 0 Saint Andrews Ct Unit 7383896
- 0 Saint Andrews Ct
- 6073 Kingston Dr Unit 2
- 6083 Kingston Dr Unit 2
- 6071 Kingston Dr
- 6085 Kingston Dr
- 0 Kingston Dr Unit 7410453
- 0 Kingston Dr Unit 7403937