Estimated Value: $407,000 - $498,000
4
Beds
4
Baths
3,429
Sq Ft
$132/Sq Ft
Est. Value
About This Home
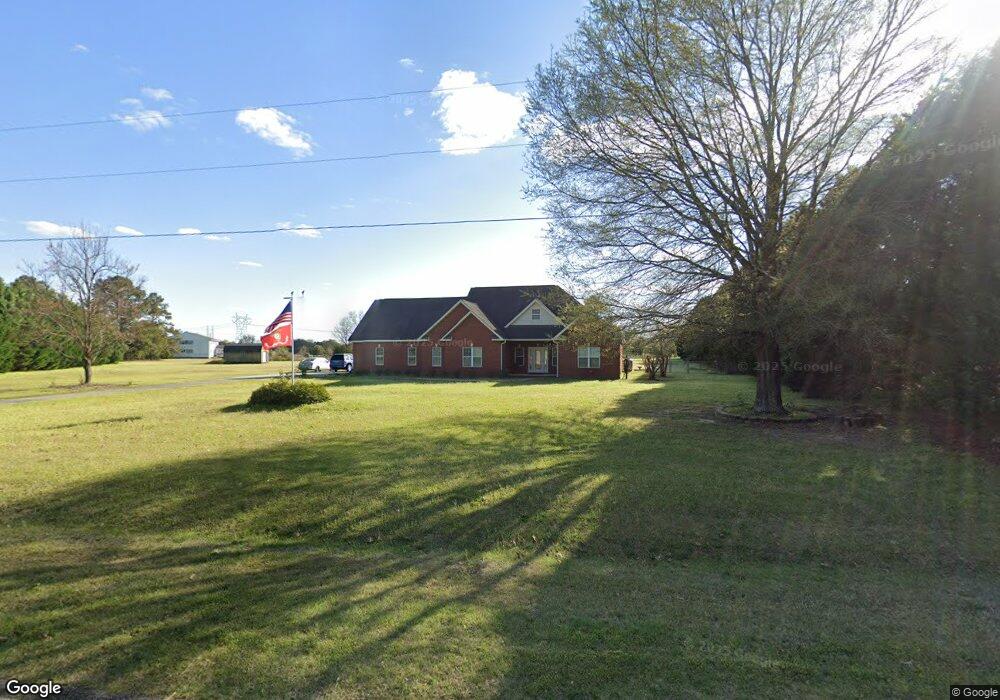
This home is located at 985 Giles Rd, Byron, GA 31008 and is currently estimated at $451,673, approximately $131 per square foot. 985 Giles Rd is a home located in Peach County with nearby schools including Byron Elementary School, Byron Middle School, and Peach County High School.
Ownership History
Date
Name
Owned For
Owner Type
Purchase Details
Closed on
Sep 7, 2011
Sold by
Morgan Darby C
Bought by
Morgan Darby C and Morgan Kathy Joyce
Current Estimated Value
Purchase Details
Closed on
May 24, 2010
Sold by
Knight Christy M
Bought by
Morgan Darby C
Home Financials for this Owner
Home Financials are based on the most recent Mortgage that was taken out on this home.
Original Mortgage
$258,250
Interest Rate
5.03%
Mortgage Type
VA
Purchase Details
Closed on
Jun 17, 2005
Sold by
Watson William
Bought by
Knight Christy M
Home Financials for this Owner
Home Financials are based on the most recent Mortgage that was taken out on this home.
Original Mortgage
$225,000
Interest Rate
8.05%
Mortgage Type
New Conventional
Purchase Details
Closed on
Jun 10, 2004
Sold by
H & H Land Development Corpora
Bought by
Watson William J and Hardeman Danie
Purchase Details
Closed on
Jun 20, 2003
Sold by
Giles William M
Bought by
H & H Land Development Corporation
Create a Home Valuation Report for This Property
The Home Valuation Report is an in-depth analysis detailing your home's value as well as a comparison with similar homes in the area
Home Values in the Area
Average Home Value in this Area
Purchase History
| Date | Buyer | Sale Price | Title Company |
|---|---|---|---|
| Morgan Darby C | -- | -- | |
| Morgan Darby C | $250,000 | -- | |
| Knight Christy M | $250,000 | -- | |
| Watson William J | $25,000 | -- | |
| H & H Land Development Corporation | $85,000 | -- |
Source: Public Records
Mortgage History
| Date | Status | Borrower | Loan Amount |
|---|---|---|---|
| Previous Owner | Morgan Darby C | $258,250 | |
| Previous Owner | Knight Christy M | $225,000 |
Source: Public Records
Tax History Compared to Growth
Tax History
| Year | Tax Paid | Tax Assessment Tax Assessment Total Assessment is a certain percentage of the fair market value that is determined by local assessors to be the total taxable value of land and additions on the property. | Land | Improvement |
|---|---|---|---|---|
| 2024 | $4,448 | $161,040 | $12,880 | $148,160 |
| 2023 | $3,787 | $135,080 | $11,520 | $123,560 |
| 2022 | $3,592 | $127,840 | $11,520 | $116,320 |
| 2021 | $3,370 | $103,400 | $11,520 | $91,880 |
| 2020 | $3,139 | $96,000 | $11,520 | $84,480 |
| 2019 | $3,153 | $96,000 | $11,520 | $84,480 |
| 2018 | $3,168 | $96,000 | $11,520 | $84,480 |
| 2017 | $3,183 | $96,000 | $11,520 | $84,480 |
| 2016 | $3,170 | $96,000 | $11,520 | $84,480 |
| 2015 | $3,170 | $96,000 | $11,520 | $84,480 |
| 2014 | $3,243 | $96,000 | $11,520 | $84,480 |
| 2013 | -- | $96,000 | $11,520 | $84,480 |
Source: Public Records
Map
Nearby Homes
- V L Hwy 42 Unit LotWP001
- 1947 Ga Highway 42
- 208 Crystal Dr
- 1947 Georgia 42
- 254 Shantz Way Unit (LOT A44)
- 350 Georgia 42
- 0 Highway 42 Unit 10576098
- 125 Buckskin Trail
- 125 Peregrine Dr
- 119 Buckskin Trail
- 35 Falcon Crest Way
- 0 Moseley Rd Unit 10582548
- 0 Moseley Rd Unit 255314
- 0 Moseley Rd Unit 180905
- 101 Fawn Ct
- 107 Silver Maple Ct
- 103 Fawn Ct
- 109 Silver Maple Ct
- 506 Howard St
- 102 Silver Maple Ct
- 204 N Haven Unit /260
- 204 N Haven
- 1041 Giles Rd
- 1051 Giles Rd
- 1064 Giles Rd
- 1015 Giles Rd
- 1075 Giles Rd
- 543 Hardison Rd
- 0 Hardison Rd Unit 7635436
- 0 Hardison Rd Unit 7563086
- 0 Hardison Rd Unit 7432189
- 0 Hardison Rd Unit 7064149
- 0 Hardison Rd Unit 3231566
- 0 Hardison Rd Unit 16 M133291
- 0 Hardison Rd Unit 16 M135102
- 1125 Giles Rd
- 1103 Giles Rd
- 1115 Giles Rd
- 1700 Ga Highway 42
- 1194 Giles Rd