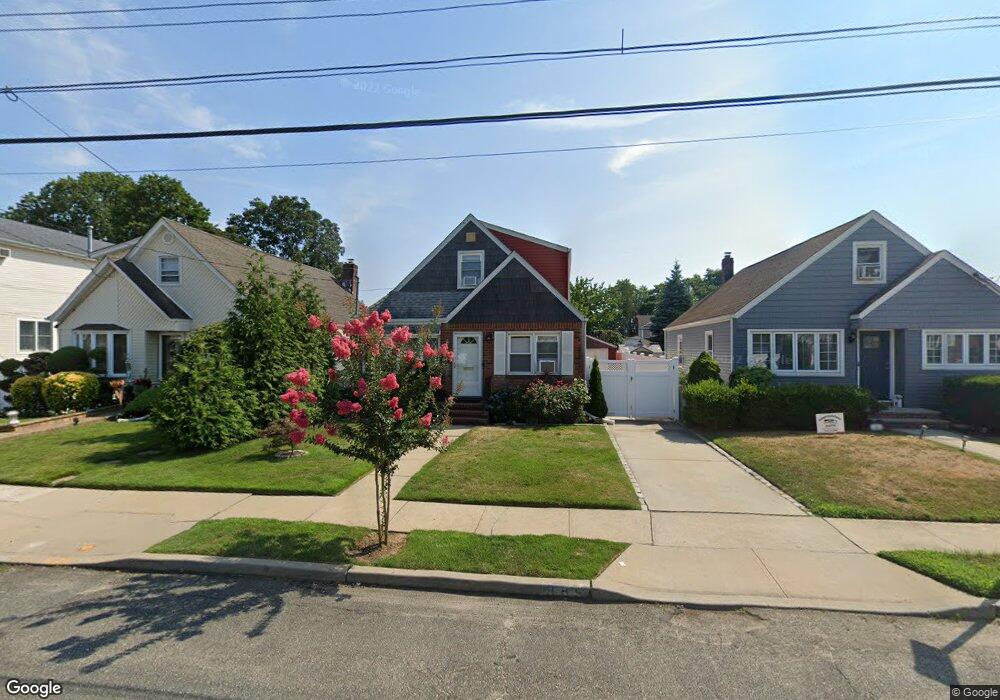
985 Third Ave Franklin Square, NY 11010
Estimated Value: $743,000 - $760,233
4
Beds
2
Baths
1,288
Sq Ft
$584/Sq Ft
Est. Value
About This Home
This home is located at 985 Third Ave, Franklin Square, NY 11010 and is currently estimated at $751,617, approximately $583 per square foot. 985 Third Ave is a home located in Nassau County with nearby schools including Cheder at the Ohel.
Ownership History
Date
Name
Owned For
Owner Type
Purchase Details
Closed on
Nov 20, 2019
Sold by
Taylor Paul A and Perez Mayra
Bought by
Taylor Paul A and Perez Mayra
Current Estimated Value
Purchase Details
Closed on
Apr 28, 2016
Sold by
Valder Earl C and Valder Miriam D
Bought by
Taylor Paul A and Suriel Paola
Home Financials for this Owner
Home Financials are based on the most recent Mortgage that was taken out on this home.
Original Mortgage
$336,000
Outstanding Balance
$265,747
Interest Rate
3.71%
Mortgage Type
New Conventional
Estimated Equity
$485,870
Create a Home Valuation Report for This Property
The Home Valuation Report is an in-depth analysis detailing your home's value as well as a comparison with similar homes in the area
Home Values in the Area
Average Home Value in this Area
Purchase History
| Date | Buyer | Sale Price | Title Company |
|---|---|---|---|
| Taylor Paul A | -- | None Available | |
| Taylor Paul A | $420,000 | None Available |
Source: Public Records
Mortgage History
| Date | Status | Borrower | Loan Amount |
|---|---|---|---|
| Open | Taylor Paul A | $336,000 |
Source: Public Records
Tax History
| Year | Tax Paid | Tax Assessment Tax Assessment Total Assessment is a certain percentage of the fair market value that is determined by local assessors to be the total taxable value of land and additions on the property. | Land | Improvement |
|---|---|---|---|---|
| 2025 | $10,986 | $513 | $248 | $265 |
| 2024 | $4,186 | $513 | $248 | $265 |
| 2023 | $10,378 | $513 | $248 | $265 |
| 2022 | $10,378 | $513 | $248 | $265 |
| 2021 | $13,201 | $503 | $243 | $260 |
| 2020 | $9,784 | $575 | $441 | $134 |
| 2019 | $8,843 | $587 | $441 | $146 |
| 2018 | $8,596 | $587 | $0 | $0 |
| 2017 | $1,992 | $587 | $417 | $170 |
| 2016 | $3,897 | $621 | $397 | $224 |
| 2015 | $1,913 | $656 | $381 | $275 |
| 2014 | $1,913 | $656 | $381 | $275 |
| 2013 | $1,870 | $690 | $401 | $289 |
Source: Public Records
Map
Nearby Homes
Your Personal Tour Guide
Ask me questions while you tour the home.