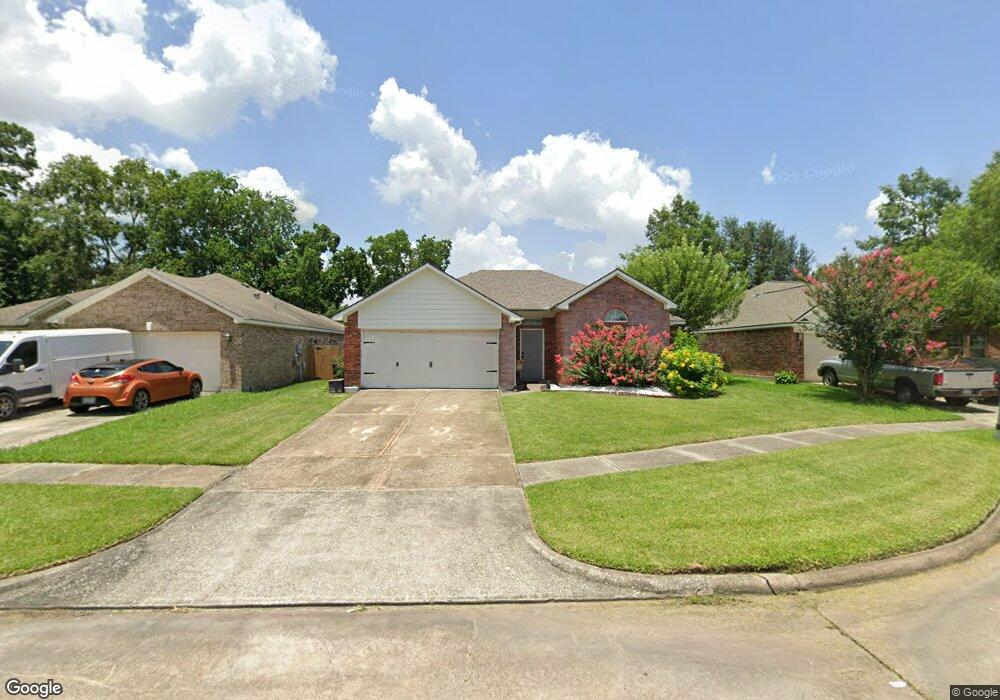
9853 Flamingo Ln Conroe, TX 77385
Estimated Value: $216,134 - $240,000
3
Beds
2
Baths
1,450
Sq Ft
$156/Sq Ft
Est. Value
About This Home
This home is located at 9853 Flamingo Ln, Conroe, TX 77385 and is currently estimated at $226,284, approximately $156 per square foot. 9853 Flamingo Ln is a home located in Montgomery County with nearby schools including Oak Ridge Elementary School, Irons J High School, and Vogel Intermediate School.
Ownership History
Date
Name
Owned For
Owner Type
Purchase Details
Closed on
Dec 31, 2004
Sold by
Kendall Homes Corp
Bought by
Davis William H and Gautier Diana Lee
Current Estimated Value
Home Financials for this Owner
Home Financials are based on the most recent Mortgage that was taken out on this home.
Original Mortgage
$92,792
Outstanding Balance
$49,910
Interest Rate
6.75%
Mortgage Type
Purchase Money Mortgage
Estimated Equity
$176,374
Purchase Details
Closed on
May 5, 2004
Sold by
Chien Larry T K and Chien Han Yu
Bought by
Kendall Homes Corp
Home Financials for this Owner
Home Financials are based on the most recent Mortgage that was taken out on this home.
Original Mortgage
$83,920
Interest Rate
5.38%
Mortgage Type
Construction
Purchase Details
Closed on
Jul 28, 1992
Sold by
Commonwealth Savings
Bought by
Davis William H and Gautier Diana L
Create a Home Valuation Report for This Property
The Home Valuation Report is an in-depth analysis detailing your home's value as well as a comparison with similar homes in the area
Home Values in the Area
Average Home Value in this Area
Purchase History
| Date | Buyer | Sale Price | Title Company |
|---|---|---|---|
| Davis William H | -- | Chicago Title Insurance Co | |
| Kendall Homes Corp | -- | Chicago Title Insurance Co | |
| Davis William H | -- | -- |
Source: Public Records
Mortgage History
| Date | Status | Borrower | Loan Amount |
|---|---|---|---|
| Open | Davis William H | $92,792 | |
| Previous Owner | Kendall Homes Corp | $83,920 | |
| Closed | Davis William H | $23,198 |
Source: Public Records
Tax History Compared to Growth
Tax History
| Year | Tax Paid | Tax Assessment Tax Assessment Total Assessment is a certain percentage of the fair market value that is determined by local assessors to be the total taxable value of land and additions on the property. | Land | Improvement |
|---|---|---|---|---|
| 2025 | $1,410 | $187,596 | $20,906 | $166,690 |
| 2024 | $1,288 | $202,301 | -- | -- |
| 2023 | $1,288 | $183,910 | $20,910 | $185,830 |
| 2022 | $3,430 | $167,190 | $20,910 | $175,510 |
| 2021 | $3,965 | $151,990 | $20,910 | $131,080 |
| 2020 | $4,140 | $150,110 | $20,910 | $131,650 |
| 2019 | $3,936 | $136,460 | $15,110 | $121,350 |
| 2018 | $2,251 | $125,510 | $15,110 | $110,400 |
| 2017 | $3,537 | $120,360 | $15,110 | $110,400 |
| 2016 | $3,216 | $109,420 | $15,110 | $99,690 |
| 2015 | $2,503 | $99,470 | $15,110 | $99,690 |
| 2014 | $2,503 | $90,430 | $15,110 | $80,120 |
Source: Public Records
Map
Nearby Homes
- 16937 Larkspur
- 9881 Youpon Ridge Way
- 16859 Blackberry Lily Ln
- 9807 Toucan Ln
- 16916 Tableland Trail
- 9903 Valance Way
- 16731 Foursquare Dr
- 9915 Valance Way
- 123 Genesee Ridge Dr
- 9877 Lace Flower Way
- 9838 Bobolink Dr
- 32457 Soaring Willow Way
- 16778 N Gull Dr
- 74 Wimberly Way
- 9976 Cassowary Dr
- 16771 N Rail Dr
- 9972 Western Ridge Way
- 16774 Fallen Timbers Dr
- 183 Fairwind Trail Dr
- 16751 N Rail Dr
- 9849 Flamingo Ln
- 9857 Flamingo Ln
- 9854 Golden Eagle St
- 9858 Golden Eagle St
- 9845 Flamingo Ln
- 9850 Golden Eagle St
- 16915 Hummingbird
- 16922 Hummingbird
- 9846 Golden Eagle St
- 16919 Hummingbird
- 9862 Golden Eagle St
- 9841 Flamingo Ln
- 16921 Larkspur
- 9842 Golden Eagle St
- 16923 Hummingbird
- 16893 Greenhouse St
- 16905 Blue Jay St
- 9837 Flamingo Ln
- 16925 Larkspur
- 16902 Blue Jay St