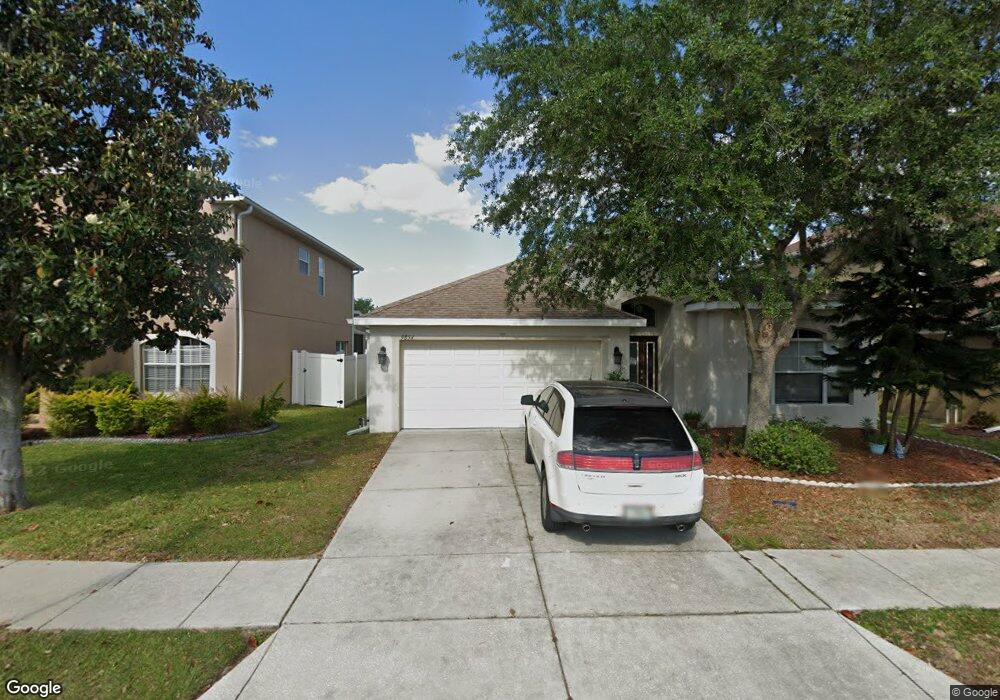
9854 Jasmine Brook Cir Land O Lakes, FL 34638
Estimated Value: $338,295 - $386,000
4
Beds
2
Baths
2,586
Sq Ft
$144/Sq Ft
Est. Value
About This Home
This home is located at 9854 Jasmine Brook Cir, Land O Lakes, FL 34638 and is currently estimated at $371,824, approximately $143 per square foot. 9854 Jasmine Brook Cir is a home located in Pasco County with nearby schools including Connerton Elementary School, Pine View Middle School, and Land O' Lakes High School.
Ownership History
Date
Name
Owned For
Owner Type
Purchase Details
Closed on
Jan 26, 2018
Sold by
2018 1 Ih Borrower Lp
Bought by
2018 1 Iii Borrower Lp
Current Estimated Value
Purchase Details
Closed on
Jun 30, 2014
Sold by
Colfin Ai-Fl 2 Llc
Bought by
Cah 2014-2 Borrower Llc
Purchase Details
Closed on
May 23, 2013
Sold by
Puello Jesus E Leo
Bought by
Col Fin Ai Fl2 Llc
Purchase Details
Closed on
Oct 26, 2006
Sold by
The Ryland Group Inc
Bought by
Leo Puello Jesus E
Home Financials for this Owner
Home Financials are based on the most recent Mortgage that was taken out on this home.
Original Mortgage
$239,775
Interest Rate
9.94%
Mortgage Type
Balloon
Purchase Details
Closed on
Mar 17, 2006
Sold by
Westfield Homes Of Florida
Bought by
The Ryland Group Inc
Create a Home Valuation Report for This Property
The Home Valuation Report is an in-depth analysis detailing your home's value as well as a comparison with similar homes in the area
Home Values in the Area
Average Home Value in this Area
Purchase History
| Date | Buyer | Sale Price | Title Company |
|---|---|---|---|
| 2018 1 Iii Borrower Lp | -- | Attorney | |
| Cah 2014-2 Borrower Llc | -- | None Available | |
| Col Fin Ai Fl2 Llc | $155,500 | None Available | |
| Leo Puello Jesus E | $252,398 | Ryland Title Company | |
| The Ryland Group Inc | $108,038 | Attorney |
Source: Public Records
Mortgage History
| Date | Status | Borrower | Loan Amount |
|---|---|---|---|
| Previous Owner | Leo Puello Jesus E | $239,775 |
Source: Public Records
Tax History Compared to Growth
Tax History
| Year | Tax Paid | Tax Assessment Tax Assessment Total Assessment is a certain percentage of the fair market value that is determined by local assessors to be the total taxable value of land and additions on the property. | Land | Improvement |
|---|---|---|---|---|
| 2025 | $5,158 | $299,565 | $60,602 | $238,963 |
| 2024 | $5,158 | $313,577 | $60,602 | $252,975 |
| 2023 | $4,927 | $321,297 | $47,192 | $274,105 |
| 2022 | $4,062 | $273,004 | $39,497 | $233,507 |
| 2021 | $3,525 | $205,321 | $32,337 | $172,984 |
| 2020 | $3,356 | $194,997 | $27,110 | $167,887 |
| 2019 | $3,238 | $186,002 | $27,110 | $158,892 |
| 2018 | $3,091 | $176,652 | $27,110 | $149,542 |
| 2017 | $2,876 | $167,683 | $27,110 | $140,573 |
| 2016 | $2,614 | $149,893 | $24,185 | $125,708 |
| 2015 | $2,386 | $128,409 | $24,185 | $104,224 |
| 2014 | $2,192 | $119,670 | $23,330 | $96,340 |
Source: Public Records
Map
Nearby Homes
- 9840 Jasmine Brook Cir
- 9954 Jasmine Brook Cir
- 9613 Jasmine Brook Cir
- 18901 New Passage Blvd
- 9711 Simeon Dr
- 9706 Simeon Dr
- 9645 Jaybird Ln
- 18439 Red Willow Way
- 10047 Landport Way
- 9551 Jaybird Ln
- 18929 Parapet Place
- 9863 Asbel Estates St
- 18446 Hunters Meadow Walk
- 18833 Litzau Ln
- 10271 Hawks Landing Dr
- 10328 Hawks Landing Dr
- 9928 Torrisdale Loop
- 10567 Heron Hideaway Loop
- 19017 Sunterra Dr
- 10194 Gliding Eagle Way
- 9850 Jasmine Brook Cir
- 9902 Jasmine Brook Cir
- 9844 Jasmine Brook Cir
- 9906 Jasmine Brook Cir
- 9958 Jasmine Brook Cir
- 9962 Jasmine Brook Cir
- 9966 Jasmine Brook Cir
- 9855 Jasmine Brook Cir
- 9912 Jasmine Brook Cir
- 9851 Jasmine Brook Cir
- 9901 Jasmine Brook Cir
- 9950 Jasmine Brook Cir
- 9905 Jasmine Brook Cir
- 9600 Jasmine Brook Cir
- 9845 Jasmine Brook Cir
- 9909 Jasmine Brook Cir
- 9836 Jasmine Brook Cir
- 9841 Jasmine Brook Cir
- 9604 Jasmine Brook Cir
- 9913 Jasmine Brook Cir