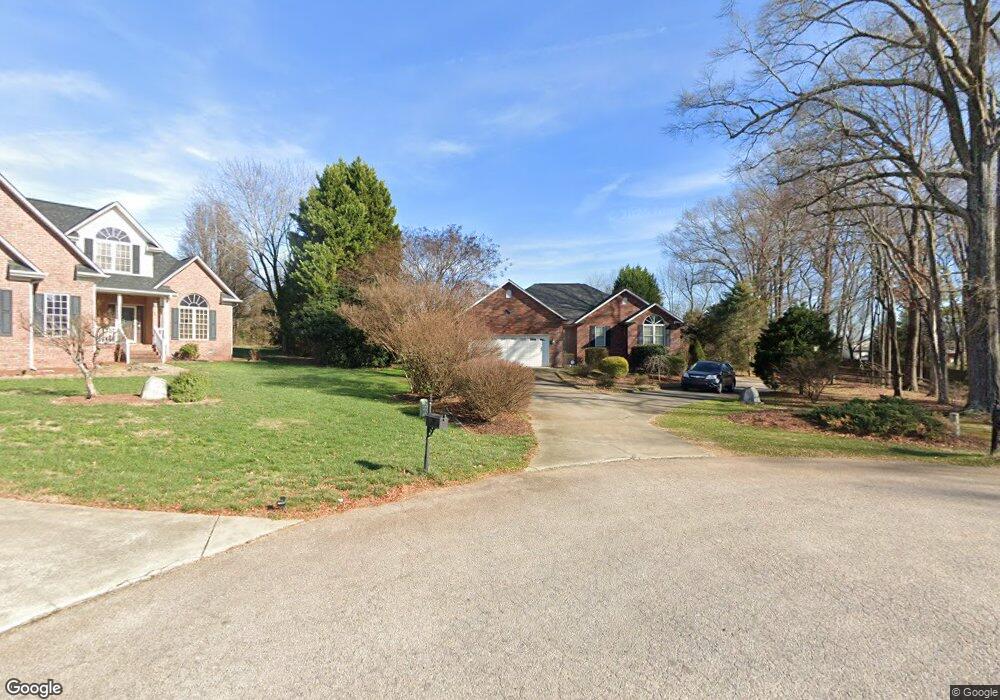
9856 Fontana Ct SW Concord, NC 28027
Estimated Value: $509,401 - $556,000
3
Beds
2
Baths
1,824
Sq Ft
$289/Sq Ft
Est. Value
About This Home
This home is located at 9856 Fontana Ct SW, Concord, NC 28027 and is currently estimated at $527,850, approximately $289 per square foot. 9856 Fontana Ct SW is a home located in Cabarrus County with nearby schools including W.R. Odell Elementary School, Harold E. Winkler Middle School, and Cox Mill High School.
Ownership History
Date
Name
Owned For
Owner Type
Purchase Details
Closed on
Mar 24, 2016
Sold by
Hill Pamela O
Bought by
Jones Thomas R and Humphrey Angela D
Current Estimated Value
Home Financials for this Owner
Home Financials are based on the most recent Mortgage that was taken out on this home.
Original Mortgage
$189,600
Outstanding Balance
$150,068
Interest Rate
3.65%
Mortgage Type
New Conventional
Estimated Equity
$377,782
Purchase Details
Closed on
Jan 5, 2000
Sold by
Tosco Michael L and Tosco Leslie A
Bought by
Hill Donald L and Hill Pamela O
Purchase Details
Closed on
Apr 2, 1998
Sold by
Finney Anthony D and Finney Crystal M
Bought by
Hill Donald L and Hill Pamela O
Home Financials for this Owner
Home Financials are based on the most recent Mortgage that was taken out on this home.
Original Mortgage
$153,000
Interest Rate
6.95%
Mortgage Type
Purchase Money Mortgage
Purchase Details
Closed on
Sep 1, 1997
Create a Home Valuation Report for This Property
The Home Valuation Report is an in-depth analysis detailing your home's value as well as a comparison with similar homes in the area
Home Values in the Area
Average Home Value in this Area
Purchase History
| Date | Buyer | Sale Price | Title Company |
|---|---|---|---|
| Jones Thomas R | $237,000 | None Available | |
| Hill Donald L | -- | -- | |
| Hill Donald L | $157,500 | -- | |
| -- | $29,500 | -- |
Source: Public Records
Mortgage History
| Date | Status | Borrower | Loan Amount |
|---|---|---|---|
| Open | Jones Thomas R | $189,600 | |
| Previous Owner | Hill Donald L | $153,000 |
Source: Public Records
Tax History Compared to Growth
Tax History
| Year | Tax Paid | Tax Assessment Tax Assessment Total Assessment is a certain percentage of the fair market value that is determined by local assessors to be the total taxable value of land and additions on the property. | Land | Improvement |
|---|---|---|---|---|
| 2025 | $3,057 | $481,410 | $122,000 | $359,410 |
| 2024 | $3,057 | $481,410 | $122,000 | $359,410 |
| 2023 | $2,458 | $297,880 | $74,000 | $223,880 |
| 2022 | $2,407 | $297,880 | $74,000 | $223,880 |
| 2021 | $2,407 | $297,880 | $74,000 | $223,880 |
| 2020 | $2,407 | $297,880 | $74,000 | $223,880 |
| 2019 | $2,190 | $271,060 | $61,000 | $210,060 |
| 2018 | $2,136 | $271,060 | $61,000 | $210,060 |
| 2017 | $2,082 | $271,060 | $61,000 | $210,060 |
| 2016 | $2,082 | $233,230 | $40,000 | $193,230 |
| 2015 | $1,768 | $233,230 | $40,000 | $193,230 |
| 2014 | $1,768 | $233,230 | $40,000 | $193,230 |
Source: Public Records
Map
Nearby Homes
- 9879 Darby Creek Ave NW
- 10149 Meeting House Dr NW
- 1123 Donelea Ln NW
- 9913 Violet Cannon Dr NW
- The Cambridge Plan at The Villas at Tucker's Walk
- The Syrah Plan at The Villas at Tucker's Walk
- The Moscato Plan at The Villas at Tucker's Walk
- The Bordeaux Plan at The Villas at Tucker's Walk
- The Merlot Plan at The Villas at Tucker's Walk
- 107 Northchase Dr
- 9910 Oaklawn Blvd NW
- 1349 Bridgeford Dr NW
- 1319 Bridgeford Dr NW
- 11332 Savannah Grove Dr
- 10326 Lemmon Ave NW
- 10409 Ambercrest Ct
- 709 Hope St
- 10436 Ambercrest Ct NW
- 615 Vega St NW
- 1086 MacAllum Dr NW
- 9855 Fontana Ct SW
- 9864 Fontana Ct SW
- 9872 Fontana Ct SW
- 9875 Fontana Ct SW
- 9871 Poplar Tent Rd
- 9851 Poplar Tent Rd
- 9873 Shearwater Ave NW
- 9869 Shearwater Ave NW
- 9877 Shearwater Ave NW
- 9865 Shearwater Ave NW
- 9881 Shearwater Ave NW
- 9861 Shearwater Ave NW
- 9887 Fontana Ct SW
- 9880 Fontana Ct SW
- 9857 Shearwater Ave NW
- 12 Moss Dr
- 211 Northchase Dr
- 225 Northchase Dr
- 185 Northchase Dr
- 0000 Moss Dr