9858 Connor Lake Cir Unit 5A Perrysburg, OH 43551
Estimated Value: $227,000 - $269,000
2
Beds
2
Baths
1,270
Sq Ft
$197/Sq Ft
Est. Value
About This Home
This home is located at 9858 Connor Lake Cir Unit 5A, Perrysburg, OH 43551 and is currently estimated at $250,288, approximately $197 per square foot. 9858 Connor Lake Cir Unit 5A is a home located in Wood County with nearby schools including Rossford Elementary School, Rossford Junior High School, and Rossford High School.
Ownership History
Date
Name
Owned For
Owner Type
Purchase Details
Closed on
Jul 22, 2014
Sold by
Courtney Tiffany and Cavanaugh Tiffany E
Bought by
Perin David E and Perin Carol A
Current Estimated Value
Home Financials for this Owner
Home Financials are based on the most recent Mortgage that was taken out on this home.
Original Mortgage
$25,000
Interest Rate
4.12%
Mortgage Type
New Conventional
Purchase Details
Closed on
Jul 28, 2006
Sold by
Jefferson Development Llc
Bought by
Courtney Tiffany
Home Financials for this Owner
Home Financials are based on the most recent Mortgage that was taken out on this home.
Original Mortgage
$141,960
Interest Rate
6.73%
Mortgage Type
Purchase Money Mortgage
Create a Home Valuation Report for This Property
The Home Valuation Report is an in-depth analysis detailing your home's value as well as a comparison with similar homes in the area
Home Values in the Area
Average Home Value in this Area
Purchase History
| Date | Buyer | Sale Price | Title Company |
|---|---|---|---|
| Perin David E | $135,000 | None Available | |
| Courtney Tiffany | $177,500 | None Available |
Source: Public Records
Mortgage History
| Date | Status | Borrower | Loan Amount |
|---|---|---|---|
| Previous Owner | Perin David E | $25,000 | |
| Previous Owner | Courtney Tiffany | $141,960 |
Source: Public Records
Tax History Compared to Growth
Tax History
| Year | Tax Paid | Tax Assessment Tax Assessment Total Assessment is a certain percentage of the fair market value that is determined by local assessors to be the total taxable value of land and additions on the property. | Land | Improvement |
|---|---|---|---|---|
| 2024 | $3,861 | $67,410 | $14,000 | $53,410 |
| 2023 | $3,861 | $67,410 | $14,000 | $53,410 |
| 2021 | $3,942 | $55,830 | $12,250 | $43,580 |
| 2020 | $3,970 | $55,830 | $12,250 | $43,580 |
| 2019 | $3,694 | $48,860 | $12,250 | $36,610 |
| 2018 | $3,694 | $48,860 | $12,250 | $36,610 |
| 2017 | $3,410 | $48,860 | $12,250 | $36,610 |
| 2016 | $3,814 | $49,810 | $12,250 | $37,560 |
| 2015 | $3,814 | $49,810 | $12,250 | $37,560 |
| 2014 | $2,963 | $49,810 | $12,250 | $37,560 |
| 2013 | $3,121 | $49,810 | $12,250 | $37,560 |
Source: Public Records
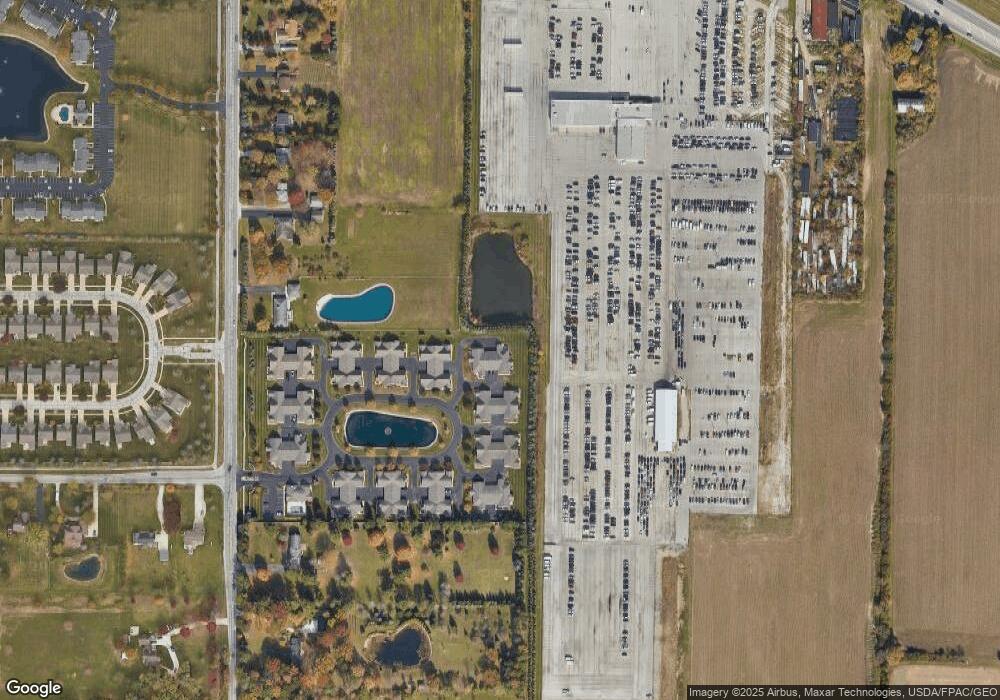
Map
Nearby Homes
- 9898 Connor Lake Cir
- 26717 Sheringham Rd
- 10453 White Oak Dr
- 26336 E Wexford Dr
- 10835 S Lakes Dr
- 26028 Turnbridge Dr
- 26333 Emerald Lakes Dr
- 504 Cathedral Ct
- 0 Truman + Lemoyne Rd Unit 6135028
- 108 Kinloch Dr
- LOT 200 Hawthorne
- LOT 195 Hawthorne
- LOT 194 Hawthorne
- 454 Blue Jacket Rd
- 431 Blue Jacket Rd
- 408 Blue Jacket Rd
- 277 Blue Jacket Rd
- 1443 S Redhawk Dr
- 26395 Carronade Dr
- 11 Meadowpond Dr Unit B
- 9858 Connor Lake Cir
- 9856 Connor Lake Cir Unit 5B
- 9854 Connor Lake Cir Unit 5D
- 9868 Connor Lake Cir
- 9868 Connor Lake Cir
- 9852 Connor Lake Cir Unit 5C
- 9852 Connor Lake Cir
- 9848 Connor Lake Cir Unit 6A
- 9848 Connor Lake Cir Unit 6-C
- 9866 Connor Lake Cir
- 9866 Connor Lake Cir
- 9844 Connor Lake Cir Unit 6D
- 9864 Connor Lake Cir
- 9864 Connor Lake Cir
- 9846 Connor Lake Cir Unit 6B
- 9844 Connor Lake
- 9842 Connor Lake Cir Unit 6C
- 9862 Connor Lake Cir
- 9862 Connor Lake
- 9847 Connor Lake Cir Unit 7A